
Page 55 - Read Online
P. 55
Page 18 of 25 Park et al. J Mater Inf 2023;3:5 https://dx.doi.org/10.20517/jmi.2022.37
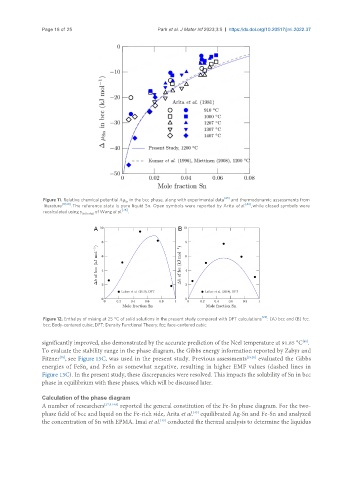
Figure 11. Relative chemical potential Δμ in the bcc phase, along with experimental data [43] and thermodynamic assessments from
Sn
literature [19,20] . The reference state is pure liquid Sn. Open symbols were reported by Arita et al. [43] , while closed symbols were
recalculated using γ Sn(in Ag) of Wang et al. [76] .
[22]
Figure 12. Enthalpy of mixing at 25 °C of solid solutions in the present study compared with DFT calculations : (A) bcc and (B) fcc.
bcc: Body-centered cubic; DFT: Density Functional Theory; fcc: face-centered cubic.
significantly improved, also demonstrated by the accurate prediction of the Néel temperature at 91.85 °C .
[80]
To evaluate the stability range in the phase diagram, the Gibbs energy information reported by Zabyr and
Fitzner , see Figure 13C, was used in the present study. Previous assessments [19,20] evaluated the Gibbs
[78]
energies of FeSn and FeSn as somewhat negative, resulting in higher EMF values (dashed lines in
2
Figure 13C). In the present study, these discrepancies were resolved. This impacts the solubility of Sn in bcc
phase in equilibrium with these phases, which will be discussed later.
Calculation of the phase diagram
A number of researchers [27,81-83] reported the general constitution of the Fe-Sn phase diagram. For the two-
[43]
phase field of bcc and liquid on the Fe-rich side, Arita et al. equilibrated Ag-Sn and Fe-Sn and analyzed
the concentration of Sn with EPMA. Imai et al. conducted the thermal analysis to determine the liquidus
[45]