Page 54 - Read Online
P. 54

Park et al. J Mater Inf 2023;3:5  https://dx.doi.org/10.20517/jmi.2022.37       Page 17 of 25


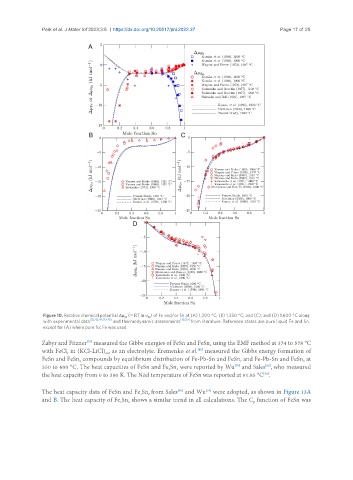
                Figure 10. Relative chemical potential Δμ  (= RT ln a ) of Fe and/or Sn at (A) 1,200 °C; (B) 1,350 °C; and (C); and (D) 1,600 °C along
                                           M       M
                               [32,42,44,70-75]               [19,20]
                with experimental data   and thermodynamic assessments   from literature. Reference states are pure liquid Fe and Sn,
                except for (A) where pure fcc Fe was used.
               Zabyr and Fitzner  measured the Gibbs energies of FeSn and FeSn  using the EMF method at 374 to 578 °C
                              [78]
                                                                        2
               with FeCl  in (KCl-LiCl)  as an electrolyte. Eremenko et al.  measured the Gibbs energy formation of
                                                                    [40]
                                     eut
                        2
               FeSn and FeSn  compounds by equilibrium distribution of Fe-Pb-Sn and FeSn, and Fe-Pb-Sn and FeSn  at
                                                                                                       2
                            2
               350 to 600 °C. The heat capacities of FeSn and Fe Sn  were reported by Wu  and Sales , who measured
                                                                                          [80]
                                                                                [79]
                                                          3
                                                             2
               the heat capacity from 0 to 380 K. The Néel temperature of FeSn was reported at 91.85 °C .
                                                                                          [80]
                                                                      [79]
               The heat capacity data of FeSn and Fe Sn from Sales  and Wu  were adopted, as shown in Figure 13A
                                                             [80]
                                                   2
                                                3
               and B. The heat capacity of Fe Sn  shows a similar trend in all calculations. The C  function of FeSn was
                                            2
                                         3
                                                                                      p
   49   50   51   52   53   54   55   56   57   58   59