Page 57 - Read Online
P. 57

Page 20 of 25                          Park et al. J Mater Inf 2023;3:5  https://dx.doi.org/10.20517/jmi.2022.37

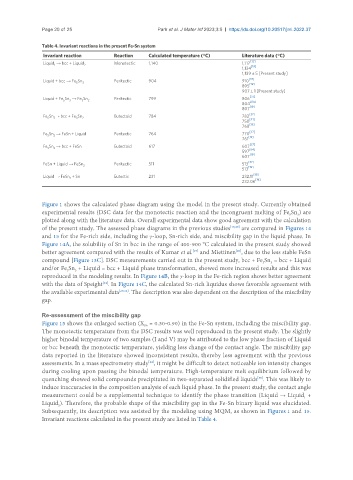
               Table 4. Invariant reactions in the present Fe-Sn system
                Invariant reaction     Reaction    Calculated temperature (°C)     Literature data (°C)
                Liquid  → bcc + Liquid 2  Monotectic  1,140                        1,117 [32]
                   1
                                                                                   1,134 [19]
                                                                                   1,139 ± 5 [Present study]
                Liquid + bcc → Fe Sn 3  Peritectic  904                            910 [37]
                           5
                                                                                   895 [19]
                                                                                   907 ± 1 [Present study]
                                                                                     [37]
                Liquid + Fe Sn  → Fe Sn  Peritectic  799                           806
                      5  3   3  2                                                    [84]
                                                                                   804
                                                                                     [19]
                                                                                   807
                                                                                     [37]
                Fe Sn → bcc + Fe Sn 2  Eutectoid   784                             782
                   3
                 5
                           3
                                                                                   750 [41]
                                                                                     [19]
                                                                                   768
                Fe Sn  → FeSn + Liquid  Peritectic  764                            770 [37]
                   2
                 3
                                                                                   761 [19]
                Fe Sn  → bcc + FeSn    Eutectoid   617                             607 [37]
                 3
                   2
                                                                                   597 [84]
                                                                                   607 [19]
                                                                                     [37]
                FeSn + Liquid → FeSn   Peritectic  511                             513
                             2                                                       [19]
                                                                                   513
                                                                                      [38]
                Liquid → FeSn + Sn     Eutectic    231                             232.11
                         2                                                             [19]
                                                                                   232.06
               Figure 1 shows the calculated phase diagram using the model in the present study. Currently obtained
               experimental results (DSC data for the monotectic reaction and the incongruent melting of Fe Sn ) are
                                                                                                     3
                                                                                                   5
               plotted along with the literature data. Overall experimental data show good agreement with the calculation
               of the present study. The assessed phase diagrams in the previous studies [19,20]  are compared in Figures 14
               and 15 for the Fe-rich side, including the γ-loop, Sn-rich side, and miscibility gap in the liquid phase. In
               Figure 14A, the solubility of Sn in bcc in the range of 400-900 °C calculated in the present study showed
                                                                                 [20]
                                                                  [19]
               better agreement compared with the results of Kumar et al.  and Miettinen , due to the less stable FeSn
               compound [Figure 13C]. DSC measurements carried out in the present study, bcc + Fe Sn  = bcc + Liquid
                                                                                          5
                                                                                            3
               and/or Fe Sn  + Liquid = bcc + Liquid phase transformation, showed more increased results and this was
                        5
                          3
               reproduced in the modeling results. In Figure 14B, the γ-loop in the Fe-rich region shows better agreement
                                    [34]
               with the data of Speight . In Figure 14C, the calculated Sn-rich liquidus shows favorable agreement with
               the available experimental data [29,32] . The description was also dependent on the description of the miscibility
               gap.
               Re-assessment of the miscibility gap
               Figure 15 shows the enlarged section (X  = 0.30-0.90) in the Fe-Sn system, including the miscibility gap.
                                                  Sn
               The monotectic temperature from the DSC results was well reproduced in the present study. The slightly
               higher binodal temperature of two samples (I and V) may be attributed to the low phase fraction of Liquid
               or bcc beneath the monotectic temperature, yielding less change of the contact angle. The miscibility gap
               data reported in the literature showed inconsistent results, thereby less agreement with the previous
               assessments. In a mass spectrometry study , it might be difficult to detect noticeable ion intensity changes
                                                   [44]
               during cooling upon passing the binodal temperature. High-temperature melt equilibrium followed by
               quenching showed solid compounds precipitated in two-separated solidified liquids . This was likely to
                                                                                        [30]
               induce inaccuracies in the composition analysis of each liquid phase. In the present study, the contact angle
               measurement could be a supplemental technique to identify the phase transition (Liquid → Liquid  +
                                                                                                        1
               Liquid ). Therefore, the probable shape of the miscibility gap in the Fe-Sn binary liquid was elucidated.
                     2
               Subsequently, its description was assisted by the modeling using MQM, as shown in Figures 1 and 15.
               Invariant reactions calculated in the present study are listed in Table 4.
   52   53   54   55   56   57   58   59   60   61   62