
Page 56 - Read Online
P. 56
Park et al. J Mater Inf 2023;3:5 https://dx.doi.org/10.20517/jmi.2022.37 Page 19 of 25
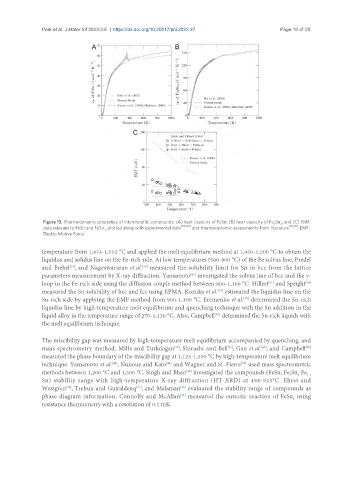
Figure 13. Thermodynamic properties of intermetallic compounds: (A) heat capacity of FeSn; (B) heat capacity of Fe Sn ; and (C) EMF
3
2
data relevant to FeSn and FeSn , plotted along with experimental data [78-80] and thermodynamic assessments from literature [19,20] . EMF:
2
Electro Motive Force.
temperature from 1,474-1,512 °C and applied the melt equilibrium method at 1,450-1,500 °C to obtain the
liquidus and solidus line on the Fe-rich side. At low temperatures (500-900 °C) of the Fe solvus line, Predel
[36]
[35]
and Frebel , and Nageswararao et al. measured the solubility limit for Sn in bcc from the lattice
parameters measurement by X-ray diffraction. Yamamoto investigated the solvus line of bcc and the γ-
[41]
[31]
[34]
loop in the Fe-rich side using the diffusion couple method between 800-1,100 °C. Hillert and Speight
measured the Sn solubility of bcc and fcc using EPMA. Kozuka et al. estimated the liquidus line on the
[32]
Sn-rich side by applying the EMF method from 900-1,100 °C. Eremenko et al. determined the Sn-rich
[40]
liquidus line by high-temperature melt equilibrium and quenching technique with the Sn addition in the
[29]
liquid alloy in the temperature range of 270-1,130 °C. Also, Campbell determined the Sn-rich liquids with
the melt equilibrium technique.
The miscibility gap was measured by high-temperature melt equilibrium accompanied by quenching, and
[30]
mass spectrometry method. Mills and Turkdogan , Shirashi and Bell , Gao et al. , and Campbell
[29]
[46]
[33]
measured the phase boundary of the miscibility gap at 1,125-1,550 °C by high-temperature melt equilibrium
[70]
[44]
[42]
technique. Yamamoto et al. , Nunoue and Kato and Wagner and St. Pierre used mass spectrometric
methods between 1,200 °C and 1,500 °C. Singh and Bhan investigated the compounds (FeSn, Fe Sn Fe 1.3
[84]
2
3
Sn) stability range with high-temperature X-ray diffraction (HT-XRD) at 498-923°C. Ehret and
[37]
Westgren , Trehux and Guiraldenq , and Malaman evaluated the stability range of compounds as
[39]
[28]
[38]
phase diagram information. Connolly and McAllan measured the eutectic reaction of FeSn using
2
resistance thermometry with a resolution of 0.1 mK.