
Page 143 - Read Online
P. 143
Page 12 of 18 Chong et al. J Mater Inf 2023;3:21 https://dx.doi.org/10.20517/jmi.2023.17
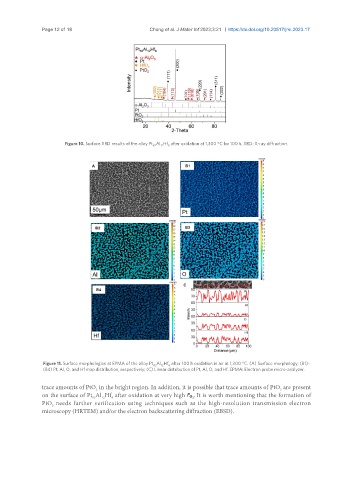
Figure 10. Surface XRD results of the alloy Pt Al Hf after oxidation at 1,300 °C for 100 h. XRD: X-ray diffraction.
82 12 6
Figure 11. Surface morphologies at EPMA of the alloy Pt Al Hf after 100 h oxidation in air at 1,300 °C. (A) Surface morphology; (B1)-
82 12 6
(B4) Pt, Al, O, and Hf map distribution, respectively; (C) Linear distribution of Pt, Al, O, and Hf. EPMA: Electron probe micro-analyzer.
trace amounts of PtO in the bright region. In addition, it is possible that trace amounts of PtO are present
2
2
on the surface of Pt Al Hf after oxidation at very high P . It is worth mentioning that the formation of
6
o2
82
12
PtO needs further verification using techniques such as the high-resolution transmission electron
2
microscopy (HRTEM) and/or the electron backscattering diffraction (EBSD).