Page 140 - Read Online
P. 140

Chong et al. J Mater Inf 2023;3:21  https://dx.doi.org/10.20517/jmi.2023.17      Page 9 of 18


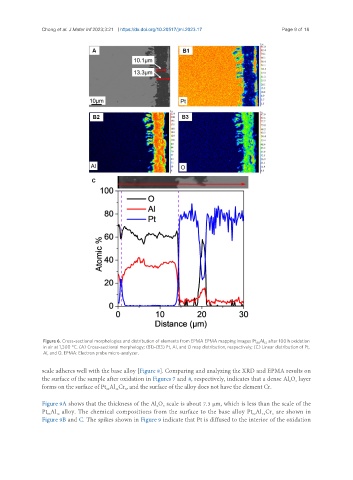
                Figure 6. Cross-sectional morphologies and distribution of elements from EPMA EPMA mapping images Pt Al  after 100 h oxidation
                                                                                          12
                                                                                        88
                in air at 1,300 °C. (A) Cross-sectional morphology; (B1)-(B3) Pt, Al, and O map distribution, respectively; (C) Linear distribution of Pt,
                Al, and O. EPMA: Electron probe micro-analyzer.
               scale adheres well with the base alloy [Figure 8]. Comparing and analyzing the XRD and EPMA results on
               the surface of the sample after oxidation in Figures 7 and 8, respectively, indicates that a dense Al O  layer
                                                                                                  2
                                                                                                     3
               forms on the surface of Pt Al Cr , and the surface of the alloy does not have the element Cr.
                                        12
                                           6
                                     82
               Figure 9A shows that the thickness of the Al O  scale is about 7.3 μm, which is less than the scale of the
                                                        3
                                                      2
               Pt Al  alloy. The chemical compositions from the surface to the base alloy Pt Al Cr  are shown in
                                                                                             6
                                                                                         12
                 88
                    12
                                                                                      82
               Figure 9B and C. The spikes shown in Figure 9 indicate that Pt is diffused to the interior of the oxidation
   135   136   137   138   139   140   141   142   143   144   145