Page 137 - Read Online
P. 137

Page 6 of 18                        Chong et al. J Mater Inf 2023;3:21  https://dx.doi.org/10.20517/jmi.2023.17

               Table 3. Measured chemical compositions of the as-prepared alloys
                Alloys                Al (at. %)             M (at. %)             Pt (at. %)
                Pt Al 12              11.78                  0                     Balance
                 88
                Pt Al Cr              11.82                  6.21                  Balance
                 82  12  6
                Pt Al Hf 6            11.64                  6.17                  Balance
                   12
                 82
                Pt Al Ta              11.72                  6.06                  Balance
                 82  12  6
               M: Cr, Hf, and Ta.


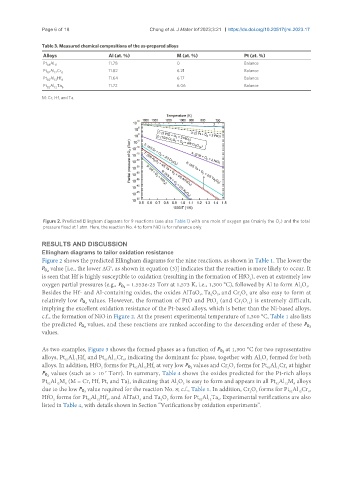
                Figure 2. Predicted Ellingham diagrams for 9 reactions (see also Table 1) with one mole of oxygen gas (mainly the O ) and the total
                                                                                               2
                pressure fixed at 1 atm. Here, the reaction No. 4 to form NiO is for reference only.

               RESULTS AND DISCUSSION
               Ellingham diagrams to tailor oxidation resistance
               Figure 2 shows the predicted Ellingham diagrams for the nine reactions, as shown in Table 1. The lower the
               P  value [i.e., the lower ΔG , as shown in equation (3)] indicates that the reaction is more likely to occur. It
                                      o
                o2
               is seen that Hf is highly susceptible to oxidation (resulting in the formation of HfO ), even at extremely low
                                                                                     2
               oxygen partial pressures (e.g., P  = 1.553e-25 Torr at 1,573 K, i.e., 1,300 °C), followed by Al to form Al O .
                                                                                                        3
                                                                                                      2
                                          o2
               Besides the Hf- and Al-containing oxides, the oxides AlTaO , Ta O , and Cr O  are also easy to form at
                                                                    4
                                                                                  2
                                                                                    3
                                                                          5
                                                                        2
               relatively low P  values. However, the formation of PtO and PtO  (and Cr O ) is extremely difficult,
                             o2
                                                                                    12
                                                                                  5
                                                                          2
               implying the excellent oxidation resistance of the Pt-based alloys, which is better than the Ni-based alloys,
               c.f., the formation of NiO in Figure 2. At the present experimental temperature of 1,300 °C, Table 1 also lists
               the predicted P  values, and these reactions are ranked according to the descending order of these P
                             o2
                                                                                                         o2
               values.
               As two examples, Figure 3 shows the formed phases as a function of P  at 1,300 °C for two representative
                                                                           o2
               alloys, Pt Al Hf  and Pt Al Cr , indicating the dominant fcc phase, together with Al O  formed for both
                                                                                         2
                                           6
                                       12
                                    82
                       82
                             6
                          12
                                                                                           3
               alloys. In addition, HfO  forms for Pt Al Hf  at very low P  values and Cr O  forms for Pt Al Cr  at higher
                                                                                                 6
                                                                 o2
                                                                                3
                                                                              2
                                   2
                                                                                           82
                                                                                              12
                                                     6
                                                 12
                                              82
               P  values (such as > 10  Torr). In summary, Table 4 shows the oxides predicted for the Pt-rich alloys
                                    -7
                o2
               Pt Al M  (M = Cr, Hf, Pt, and Ta), indicating that Al O  is easy to form and appears in all Pt Al M  alloys
                                                                                              82
                                                                                                    6
                                                             2
                 82
                       6
                    12
                                                                                                 12
                                                               3
               due to the low P  value required for the reaction No. 8; c.f., Table 1. In addition, Cr O  forms for Pt Al Cr ,
                                                                                                      12
                             o2
                                                                                       3
                                                                                                         6
                                                                                                   82
                                                                                     2
               HfO  forms for Pt Al Hf , and AlTaO  and Ta O  form for Pt Al Ta . Experimental verifications are also
                                     6
                                                4
                                  12
                   2
                               82
                                                                       12
                                                                           6
                                                                    82
                                                       2
                                                         5
               listed in Table 4, with details shown in Section “Verifications by oxidation experiments”.
   132   133   134   135   136   137   138   139   140   141   142