
Page 142 - Read Online
P. 142
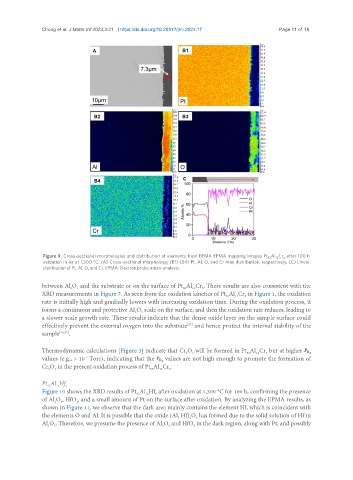
Chong et al. J Mater Inf 2023;3:21  https://dx.doi.org/10.20517/jmi.2023.17     Page 11 of 18


                Figure 9. Cross-sectional morphologies and distribution of elements from EPMA EPMA mapping images Pt Al Cr  after 100 h
                                                                                           82
                                                                                              12
                                                                                                 6
                oxidation in air at 1,300 °C. (A) Cross-sectional morphology; (B1)-(B4) Pt, Al, O, and Cr map distribution, respectively; (C) Linear
                distribution of Pt, Al, O, and Cr. EPMA: Electron probe micro-analyzer.
               between Al O  and the substrate or on the surface of Pt Al Cr . These results are also consistent with the
                         2
                                                                  12
                                                                     6
                           3
                                                               82
               XRD measurements in Figure 7. As seen from the oxidation kinetics of Pt Al Cr  in Figure 1, the oxidation
                                                                             82
                                                                                   6
                                                                                12
               rate is initially high and gradually lowers with increasing oxidation time. During the oxidation process, it
               forms a continuous and protective Al O  scale on the surface, and then the oxidation rate reduces, leading to
                                              2
                                                 3
               a slower scale growth rate. These results indicate that the dense oxide layer on the sample surface could
                                                                [35]
               effectively prevent the external oxygen into the substrate  and hence protect the internal stability of the
               sample [36,37] .
               Thermodynamic calculations [Figure 3] indicate that Cr O  will be formed in Pt Al Cr  but at higher P
                                                                                           6
                                                                2
                                                                                                         o2
                                                                                    82
                                                                                       12
                                                                  3
               values (e.g., > 10  Torr), indicating that the P  values are not high enough to promote the formation of
                              -7
                                                       o2
               Cr O  in the present oxidation process of Pt Al Cr .
                                                       12
                                                          6
                                                    82
                   3
                 2
               Pt Al Hf 6
                    12
                 82
               Figure 10 shows the XRD results of Pt Al Hf  after oxidation at 1,300 °C for 100 h, confirming the presence
                                                     6
                                               82
                                                  12
               of Al O , HfO , and a small amount of Pt on the surface after oxidation. By analyzing the EPMA results, as
                   2
                      3
                           2
               shown in Figure 11, we observe that the dark area mainly contains the element Hf, which is coincident with
               the elements O and Al. It is possible that the oxide (Al, Hf) O  has formed due to the solid solution of Hf in
                                                                 2
                                                                   3
               Al O . Therefore, we presume the presence of Al O  and HfO  in the dark region, along with Pt, and possibly
                                                          3
                                                        2
                                                                  2
                 2
                   3