
Page 138 - Read Online
P. 138
Chong et al. J Mater Inf 2023;3:21 https://dx.doi.org/10.20517/jmi.2023.17 Page 7 of 18
Table 4. Summary of the oxides formed in the Pt-rich alloys at 1,300 °C according to the present thermodynamic calculations and the
present oxidation experiments
Alloys Predicted oxides Measured oxides XRD figures
a
Pt Al 12 Al O 3 Al O (α-Al O + γ-Al O ) Figure 4
3
2
2
3
2
88
2
3
Pt Al Cr 6 Al O , Cr O 3 b Al O 3 Figure 7
82
2
3
2
2
12
c
Pt Al Hf Al O , HfO (Al, Hf) O , Al O , HfO , PtO Figure 10
82 12 6 2 3 2 2 3 2 3 2 2
Pt Al Ta 6 AlTaO , Al O , Ta O 5 Al O , AlTaO , Ta O , PtO 2 c Figure 13
2
12
4
3
2
2
4
2
5
82
3
a b -7
Al O represents the stable α-Al O in the present work if there is no further explanation; Cr O formed at high P values such as > 10 Torr;
3
2
2
2
3
3
o2
c
Trace amount or without PtO . XRD: X-ray diffraction.
2
Figure 3. Formed phases for two representative alloys of Pt Al Cr and Pt Al Hf at 1,300 °C as a function of the partial pressure of
82
6
12
12
82
6
O gas (P ), where the input of each alloy is 1 mole and the gas phase is fixed but with zero amount during thermodynamic calculations.
2
o2
Here, we do not distinguish the fcc phase and the L1 phase, which were modeled by the same sublattice model [20] .
2
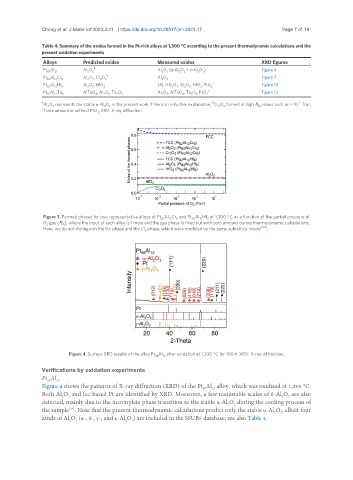
Figure 4. Surface XRD results of the alloy Pt Al after oxidation at 1,300 °C for 100 h. XRD: X-ray diffraction.
88 12
Verifications by oxidation experiments
Pt Al 12
88
Figure 4 shows the patterns of X-ray diffraction (XRD) of the Pt Al alloy, which was oxidized at 1,300 °C.
88
12
Both Al O and fcc-based Pt are identified by XRD. Moreover, a few metastable scales of θ-Al O are also
2
3
2
3
detected, mainly due to the incomplete phase transition to the stable α-Al O during the cooling process of
3
2
[34]
the sample . Note that the present thermodynamic calculations predict only the stable α-Al O , albeit four
3
2
kinds of Al O (α-, δ-, γ-, and κ-Al O ) are included in the SSUB5 database; see also Table 4.
2
3
3
2