Page 145 - Read Online
P. 145

Page 14 of 18                       Chong et al. J Mater Inf 2023;3:21  https://dx.doi.org/10.20517/jmi.2023.17


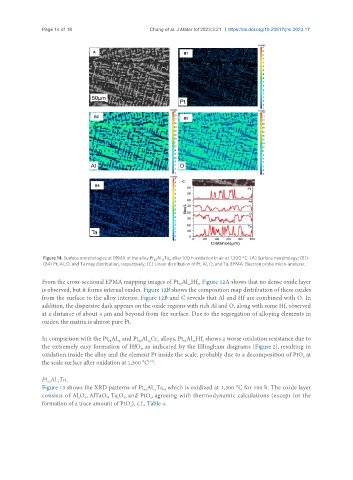
                Figure 14. Surface morphologies at EPMA of the alloy Pt Al Ta  after 100 h oxidation in air at 1,300 °C. (A) Surface morphology; (B1)-
                                                       12
                                                          6
                                                     82
                (B4) Pt, Al, O, and Ta map distribution, respectively; (C) Linear distribution of Pt, Al, O, and Ta. EPMA: Electron probe micro-analyzer.
               From the cross-sectional EPMA mapping images of Pt Al Hf , Figure 12A shows that no dense oxide layer
                                                                12
                                                             82
                                                                    6
               is observed, but it forms internal oxides. Figure 12B shows the composition map distribution of these oxides
               from the surface to the alloy interior. Figure 12B and C reveals that Al and Hf are combined with O. In
               addition, the dispersive dark appears on the oxide regions with rich Al and O, along with some Hf, observed
               at a distance of about 4 μm and beyond from the surface. Due to the segregation of alloying elements in
               oxides, the matrix is almost pure Pt.

               In comparison with the Pt Al  and Pt Al Cr  alloys, Pt Al Hf  shows a worse oxidation resistance due to
                                                   12
                                                82
                                         12
                                                                  12
                                                               82
                                                                     6
                                                      6
                                     88
               the extremely easy formation of HfO , as indicated by the Ellingham diagrams [Figure 2], resulting in
                                                2
               oxidation inside the alloy and the element Pt inside the scale, probably due to a decomposition of PtO  at
                                                                                                       2
                                                   [10]
               the scale surface after oxidation at 1,300 °C .
               Pt Al Ta 6
                    12
                 82
               Figure 13 shows the XRD patterns of Pt Al Ta , which is oxidized at 1,300 °C for 100 h. The oxide layer
                                                        6
                                                 82
                                                     12
               consists of Al O , AlTaO , Ta O , and PtO , agreeing with thermodynamic calculations (except for the
                                     4
                                           5
                                         2
                              3
                           2
                                                    2
               formation of a trace amount of PtO ), c.f., Table 4.
                                             2
   140   141   142   143   144   145   146   147   148   149   150