Page 146 - Read Online
P. 146

Chong et al. J Mater Inf 2023;3:21  https://dx.doi.org/10.20517/jmi.2023.17     Page 15 of 18


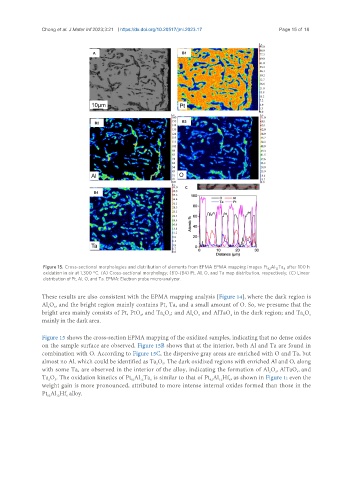
                Figure 15. Cross-sectional morphologies and distribution of elements from EPMA EPMA mapping images Pt Al Ta  after 100 h
                                                                                              12
                                                                                           82
                                                                                                 6
                oxidation in air at 1,300 °C. (A) Cross-sectional morphology; (B1)-(B4) Pt, Al, O, and Ta map distribution, respectively; (C) Linear
                distribution of Pt, Al, O, and Ta. EPMA: Electron probe micro-analyzer.
               These results are also consistent with the EPMA mapping analysis [Figure 14], where the dark region is
               Al O , and the bright region mainly contains Pt, Ta, and a small amount of O. So, we presume that the
                 2
                   3
               bright area mainly consists of Pt, PtO , and Ta O ; and Al O  and AlTaO  in the dark region; and Ta O
                                                                                                       2
                                                          5
                                                                  2
                                                                    3
                                                                               4
                                                2
                                                        2
                                                                                                         5
               mainly in the dark area.
               Figure 15 shows the cross-section EPMA mapping of the oxidized samples, indicating that no dense oxides
               on the sample surface are observed. Figure 15B shows that at the interior, both Al and Ta are found in
               combination with O. According to Figure 15C, the dispersive gray areas are enriched with O and Ta, but
               almost no Al, which could be identified as Ta O . The dark oxidized regions with enriched Al and O, along
                                                      2
                                                        5
               with some Ta, are observed in the interior of the alloy, indicating the formation of Al O , AlTaO , and
                                                                                                     4
                                                                                              3
                                                                                            2
               Ta O . The oxidation kinetics of Pt Al Ta  is similar to that of Pt Al Hf , as shown in Figure 1; even the
                                                                           12
                                                                              6
                                             82
                   5
                 2
                                                                        82
                                                    6
                                                12
               weight gain is more pronounced, attributed to more intense internal oxides formed than those in the
               Pt Al Hf  alloy.
                 82
                    12
                       6
   141   142   143   144   145   146   147   148   149   150   151