
Page 211 - Read Online
P. 211
Zhang et al. J Cancer Metastasis Treat 2018;4:16 I http://dx.doi.org/10.20517/2394-4722.2018.01 Page 3 of 11
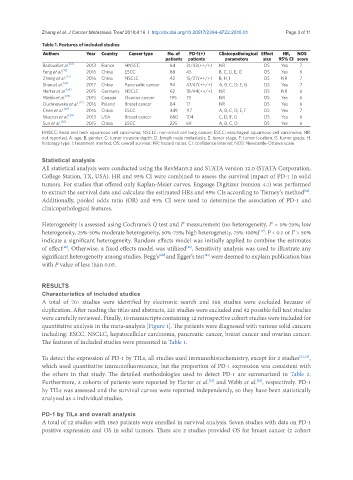
Table 1. Features of included studies
Authors Year Country Cancer type No. of PD-1(+) Clinicopathological Effect HR, NOS
patients patients parameters size 95% CI score
Badoual et al. [12] 2013 France HNSCC 64 31/33(++/+) NR OS Yes 7
Feng et al. [13] 2016 China ESCC 88 45 B, C, D, E, G OS Yes 6
Zheng et al. [22] 2016 China NSCLC 42 15/27(++/+) B, H, I OS NR 7
Shen et al. [23] 2017 China Pancreatic cancer 94 47/47(++/+) A, B, C, D, E, G OS Yes 7
Harter et al. [24] 2015 Germany NSCLC 62 18/44(++/+) NR OS NR 6
Webb et al. [25] 2015 Canada Ovarian cancer 195 75 NR OS Yes 6
Duchnowska et al. [27] 2016 Poland Breast cancer 84 17 NR OS Yes 6
Chen et al. [28] 2016 China ESCC 349 117 A, B, C, D, E, F OS Yes 7
Muenst et al. [29] 2013 USA Breast cancer 660 104 C, D, E, G OS Yes 6
Sun et al. [30] 2015 China ESCC 225 69 A, B, C, D OS Yes 6
HNSCC: head and neck squamous cell carcinoma; NSCLC: non-small cell lung cancer; ESCC: esophageal squamous cell carcinoma; NR:
not reported; A: age; B: gender; C: tumor invasion depth; D: lymph node metastasis; E: tumor stage; F: tumor location; G: tumor grade; H:
histology type; I: treatment method; OS: overall survival; HR: hazard ratios; CI: confidence interval; NOS: Newcastle-Ottawa scale
Statistical analysis
All statistical analysis were conducted using the RevMan5.2 and STATA version 12.0 (STATA Corporation,
College Station, TX, USA). HR and 95% CI were combined to assess the survival impact of PD-1 in solid
tumors. For studies that offered only Kaplan-Meier curves, Engauge Digitizer (version 4.1) was performed
to extract the survival data and calculate the estimated HRs and 95% CIs according to Tierney’s method .
[16]
Additionally, pooled odds ratio (OR) and 95% CI were used to determine the association of PD-1 and
clinicopathological features.
Heterogeneity is assessed using Cochrane’s Q test and I measurement (no heterogeneity, I = 0%-25%; low
2
2
heterogeneity, 25%-50%; moderate heterogeneity, 50%-75%; high heterogeneity, 75%-100%) . P < 0.1 or I > 50%
[17]
2
indicate a significant heterogeneity. Random effects model was initially applied to combine the estimates
of effect . Otherwise, a fixed effects model was utilized . Sensitivity analysis was used to illustrate any
[18]
[19]
significant heterogeneity among studies. Begg’s and Egger’s test were deemed to explain publication bias
[20]
[21]
with P value of less than 0.05.
RESULTS
Characteristics of included studies
A total of 701 studies were identified by electronic search and 388 studies were excluded because of
duplication. After reading the titles and abstracts, 221 studies were excluded and 92 possible full text studies
were carefully reviewed. Finally, 10 manuscripts containing 12 retrospective cohort studies were included for
quantitative analysis in the meta-analysis [Figure 1]. The patients were diagnosed with various solid cancers
including: ESCC, NSCLC, hepatocellular carcinoma, pancreatic cancer, breast cancer and ovarian cancer.
The features of included studies were presented in Table 1.
To detect the expression of PD-1 by TILs, all studies used immunohistochemistry, except for 2 studies [22,23] ,
which used quantitative immunofluorescence, but the proportion of PD-1 expression was consistent with
the others in that study. The detailed methodologies used to detect PD-1 are summarized in Table 2.
Furthermore, 2 cohorts of patients were reported by Harter et al. and Webb et al. , respectively. PD-1
[25]
[24]
by TILs was assessed and the survival curves were reported independently, so they have been statistically
analyzed as 4 individual studies.
PD-1 by TILs and overall analysis
A total of 12 studies with 1863 patients were enrolled in survival analysis. Seven studies with data on PD-1
positive expression and OS in solid tumors. There are 2 studies provided OS for breast cancer (2 cohort