
Page 213 - Read Online
P. 213
Zhang et al. J Cancer Metastasis Treat 2018;4:16 I http://dx.doi.org/10.20517/2394-4722.2018.01 Page 5 of 11
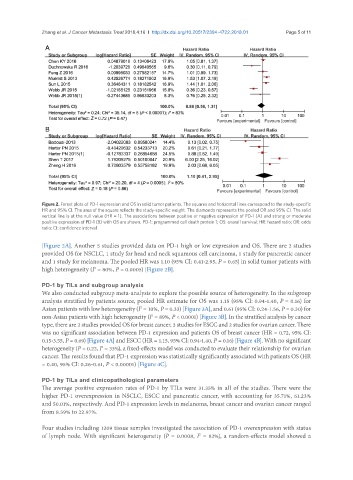
Figure 2. Forest plots of PD-1 expression and OS in solid tumor patients. The squares and horizontal lines correspond to the study-specific
HR and 95% CI. The area of the square reflects the study-specific weight. The diamonds represents the pooled OR and 95% CI. The solid
vertical line is at the null value (HR = 1). The associations between positive or negative expression of PD-1 (A) and strong or moderate
positive expression of PD-1 (B) with OS are shown. PD-1: programmed cell death protein 1; OS: overall survival; HR: hazard ratio; OR: odds
ratio; CI: confidence interval
[Figure 2A]. Another 5 studies provided data on PD-1 high or low expression and OS. There are 2 studies
provided OS for NSCLC, 1 study for head and neck squamous cell carcinoma, 1 study for pancreatic cancer
and 1 study for melanoma. The pooled HR was 1.10 (95% CI: 0.41-2.95, P = 0.65) in solid tumor patients with
2
high heterogeneity (I = 80%, P = 0.0005) [Figure 2B].
PD-1 by TILs and subgroup analysis
We also conducted subgroup meta-analysis to explore the possible source of heterogeneity. In the subgroup
analysis stratified by patients source, pooled HR estimate for OS was 1.15 (95% CI: 0.94-1.40, P = 0.16) for
Asian patients with low heterogeneity (I = 10%, P = 0.33) [Figure 3A], and 0.61 (95% CI: 0.24-1.56, P = 0.30) for
2
non-Asian patients with high heterogeneity (I = 89%, P < 0.0001) [Figure 3B]. In the stratified analysis by cancer
2
type, there are 2 studies provided OS for breast cancer, 3 studies for ESCC and 2 studies for ovarian cancer. There
was no significant association between PD-1 expression and patients OS of breast cancer (HR = 0.72, 95% CI:
0.15-3.55, P = 0.69) [Figure 4A] and ESCC (HR = 1.15, 95% CI: 0.94-1.40, P = 0.16) [Figure 4B]. With no significant
heterogeneity (P = 0.22, I = 33%), a fixed-effects model was conducted to evaluate their relationship for ovarian
2
cancer. The results found that PD-1 expression was statistically significantly associated with patients OS (HR
= 0.40, 95% CI: 0.26-0.61, P < 0.00001) [Figure 4C].
PD-1 by TILs and clinicopathological parameters
The average positive expression rates of PD-1 by TILs were 31.35% in all of the studies. There were the
higher PD-1 overexpression in NSCLC, ESCC and pancreatic cancer, with accounting for 35.71%, 61.23%
and 50.01%, respectively. And PD-1 expression levels in melanoma, breast cancer and ovarian cancer ranged
from 8.59% to 22.97%.
Four studies including 1209 tissue samples investigated the association of PD-1 overexpression with status
of lymph node. With significant heterogeneity (P = 0.0008, I = 82%), a random-effects model showed a
2