
Page 214 - Read Online
P. 214
Page 6 of 11 Zhang et al. J Cancer Metastasis Treat 2018;4:16 I http://dx.doi.org/10.20517/2394-4722.2018.01
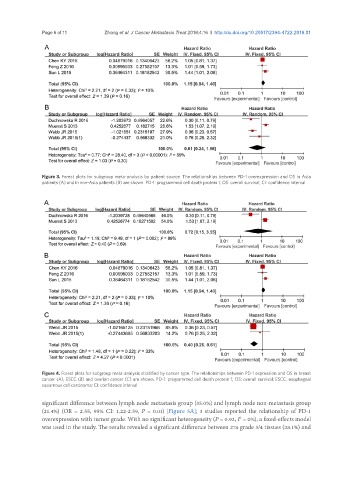
Figure 3. Forest plots for subgroup meta-analysis by patient source. The relationships between PD-1 overexpression and OS in Asia
patients (A) and in non-Asia patients (B) are shown. PD-1: programmed cell death protein 1; OS: overall survival; CI: confidence interval
Figure 4. Forest plots for subgroup meta-analysis stratified by cancer type. The relationships between PD-1 expression and OS in breast
cancer (A), ESCC (B) and ovarian cancer (C) are shown. PD-1: programmed cell death protein 1; OS: overall survival; ESCC: esophageal
squamous cell carcinoma; CI: confidence interval
significant difference between lymph node metastasis group (35.0%) and lymph node non-metastasis group
(21.4%) (OR = 2.55, 95% CI: 1.22-2.59, P = 0.01) [Figure 5A]; 3 studies reported the relationship of PD-1
2
overexpression with tumor grade. With no significant heterogeneity (P = 0.92, I = 0%), a fixed-effects model
was used in the study. The results revealed a significant difference between 274 grade 3/4 tissues (28.1%) and