
Page 212 - Read Online
P. 212
Page 4 of 11 Zhang et al. J Cancer Metastasis Treat 2018;4:16 I http://dx.doi.org/10.20517/2394-4722.2018.01
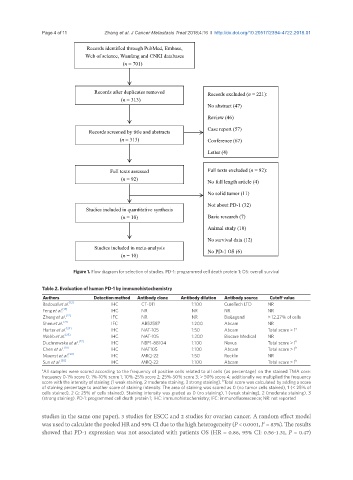
Records identified through PubMed, Embase,
Web of science, Wanfang and CNKI databases
(n = 701)
Records after duplicates removed Records excluded (n = 221):
(n = 313)
No abstract (47)
Review (46)
Records screened by title and abstracts Case report (57)
(n = 313) Conference (67)
Letter (4)
Full texts assessed Full texts excluded (n = 82):
(n = 92)
No full length article (4)
No solid tumor (11)
Not about PD-1 (32)
Studies included in quantitative synthesis
(n = 10) Basic research (7)
Animal study (10)
No survival data (12)
Studies included in meta-analysis No PD-1 OS (6)
(n = 10)
Figure 1. Flow diagram for selection of studies. PD-1: programmed cell death protein 1; OS: overall survival
Table 2. Evaluation of human PD-1 by immunohistochemistry
Authors Detection method Antibody clone Antibody dilution Antibody source Cutoff value
Badoual et al. [12] IHC CT-011 1:100 CureTech LTD NR
Feng et al. [13] IHC NR NR NR NR
Zheng et al. [22] IFC NR NR BioLegend > 12.27% of cells
Shen et al. [23] IFC AB52587 1:200 Abcam NR
Harter et al. [24] IHC NAT-105 1:50 Abcam Total score > 1 a
Webb et al. [25] IHC NAT-105 1:200 Biocare Medical NR
Duchnowska et al. [27] IHC NBP1-88104 1:100 Novus Total score > 1 b
Chen et al. [28] IHC NAT105 1:100 Abcam Total score > 1 b
Muenst et al. [29] IHC MRQ-22 1:50 Rocklin NR
Sun et al. [30] IHC MRQ-22 1:100 Abcam Total score > 1 b
a All samples were scored according to the frequency of positive cells related to all cells (as percentage) on the stained TMA core:
frequency 0-1% score 0; 1%-10% score 1; 10%-25% score 2; 25%-50% score 3; > 50% score 4; additionally we multiplied the frequency
score with the intensity of staining (1 weak staining, 2 moderate staining, 3 strong staining). Total score was calculated by adding a score
b
of staining percentage to another score of staining intensity. The area of staining was scored as 0 (no tumor cells stained), 1 (< 25% of
cells stained), 2 (≥ 25% of cells stained). Staining intensity was graded as 0 (no staining), 1 (weak staining), 2 (moderate staining), 3
(strong staining). PD-1: programmed cell death protein 1; IHC: immunohistochemistry; IFC: immunofluorescence; NR: not reported
studies in the same one paper), 3 studies for ESCC and 2 studies for ovarian cancer. A random effect model
was used to calculate the pooled HR and 95% CI due to the high heterogeneity (P < 0.0001, I = 83%). The results
2
showed that PD-1 expression was not associated with patients OS (HR = 0.86, 95% CI: 0.56-1.31, P = 0.47)