
Page 215 - Read Online
P. 215
Zhang et al. J Cancer Metastasis Treat 2018;4:16 I http://dx.doi.org/10.20517/2394-4722.2018.01 Page 7 of 11
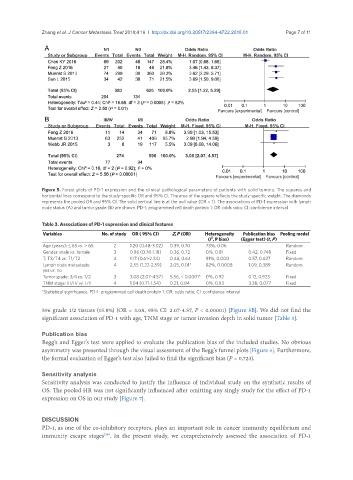
Figure 5. Forest plots of PD-1 expression and the clinical pathological parameters of patients with solid tumors. The squares and
horizontal lines correspond to the study-specific OR and 95% CI. The area of the square reflects the study-specific weight. The diamonds
represents the pooled OR and 95% CI. The solid vertical line is at the null value (OR = 1). The associations of PD-1 expression with lymph
node status (A) and tumor grade (B) are shown. PD-1: programmed cell death protein 1; OR: odds ratio; CI: confidence interval
Table 3. Associations of PD-1 expression and clinical features
Variables No. of study OR ( 95% CI) Z, P (OR) Heterogeneity Publication bias Pooling model
2
(I , P bias) (Egger test) (t, P)
Age (years): ≤ 65 vs. > 65 2 1.20 (0.48-3.02) 0.39, 0.70 73%, 0.06 - Random
Gender: male vs. female 3 0.96 (0.78-1.18) 0.36, 0.72 0%, 0.81 0.42, 0.748 Fixed
T: T3/T4 vs. T1/T2 4 1.17 (0.61-2.24) 0.48, 0.64 91%, 0.000 0.57, 0.627 Random
Lymph node metastasis: 4 2.55 (1.22-2.59) 2.05, 0.01* 82%, 0.0008 1.09, 0.389 Random
yes vs. no
Tumor grade: 3/4 vs. 1/2 3 3.08 (2.07-4.57) 5.56, < 0.0001* 0%, 0.92 0.12, 0.923 Fixed
TNM stage: III/IV vs. I/II 4 1.04 (0.71-1.54) 0.21, 0.84 0%, 0.93 3.38, 0.077 Fixed
*Statistical significance. PD-1: programmed cell death protein 1; OR: odds ratio; CI: confidence interval
596 grade 1/2 tissues (15.8%) (OR = 3.08, 95% CI: 2.07-4.57, P < 0.00001) [Figure 5B]. We did not find the
significant association of PD-1 with age, TNM stage or tumor invasion depth in solid tumor [Table 3].
Publication bias
Begg’s and Egger’s test were applied to evaluate the publication bias of the included studies. No obvious
asymmetry was presented through the visual assessment of the Begg’s funnel plots [Figure 6]. Furthermore,
the formal evaluation of Egger’s test also failed to find the significant bias (P = 0.723).
Sensitivity analysis
Sensitivity analysis was conducted to justify the influence of individual study on the synthetic results of
OS. The pooled HR was not significantly influenced after omitting any singly study for the effect of PD-1
expression on OS in our study [Figure 7].
DISCUSSION
PD-1, as one of the co-inhibitory receptors, plays an important role in cancer immunity equilibrium and
immunity escape stages . In the present study, we comprehensively assessed the association of PD-1
[26]