
Page 166 - Read Online
P. 166
alone, and excellent clustering was observed with RT-PCR and -1.03 in TCGA). The raw expression data
only two misclassifications [Supplementary Figure 3]. of 8 miRNAs were showed in Supplementary Table 4.
Percentages of correctly classified HCC tissues were
96% and 99% for the 48 paired and 302 unpaired tumor Aberrant miRNAs panels associated with etiology-
tissues respectively [Table 2], suggesting the promise specific HCC
of aberrantly expressed miRNAs as HCC biomarkers. Subgroup analyses for three HCC-specific major
etiologic factors (alcohol abuse, HBV and HCV
We validated the findings from TCGA data by infection) by two-sample t-tests, we identified 4
measuring miRNA profiles in 32 paired HCC tissues upregulated (miR-10b, miR-21, miR-500a and miR-532)
from CUMC. We observed 40 miRNAs significantly and 8 downregulated miRNAs panel significantly
deregulated in HCC tumors (P < 0.05) with over 2-fold associated with alcohol-related HCC [Table 3,
changes [Supplementary Figure 4], and 14 (let-7c, Supplementary Figure 5A]. The 12-miRNAs panel
miR-21, miR-99a, miR-125b, miR-130a, miR-139, miR- can distinguish alcohol-related HCC tumor from
144, miR-145, miR-150, miR-199a, miR-223, miR-378, non-tumor with 3 misclassifications [Supplementary
miR-455 and miR-486) overlap with those identified Figure 5B]. There were panels of 7 and 4 significant
in TCGA data. Eight miRNAs (miR-122, miR-1180, aberrantly expressed miRNAs observed in HBV- or
miR-199a, miR-182, miR-152, miR-125b, miR-18a and HCV-related HCC, respectively, with over 2-fold
miR-10a) with various expression levels in TCGA data expression changes [Table 3, Supplementary Figure 6].
were randomly selected and evaluated by TaqMan These miRNA panels can also correctly classify HBV-
quantitative reverse transcription polymerase chain or HCV-infected tumors with 1-2 misclassifications
reaction (RT-PCR) in 66 paired HCC tissues from [Supplementary Figure 7]. Comparison of significant
CUMC. Seven out of 8 miRNAs had consistent fold- miRNAs for HCCs with different etiologies and overall
changes as in TCGA data [Supplementary Table 3]. Only HCCs, only miR-424 was consistently down-regulated
miR-152 showed an inconsistent fold-change (1.01 in among all HCC groups; miR-6b was only significantly
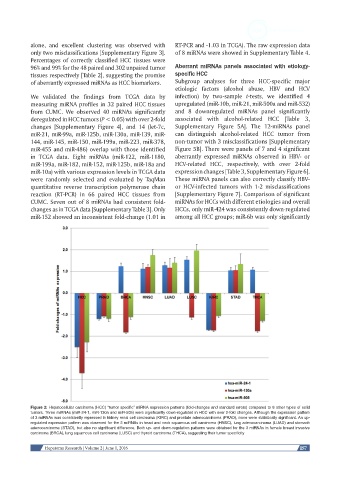
Figure 2: Hepatocellular carcinoma (HCC) “tumor specific” miRNA expression patterns (fold-changes and standard errors) compared to 8 other types of solid
tumors. Three miRNAs (miR-24-1, miR-130a and miR-505) were significantly down-regulated in HCC with over 2-fold changes. Although the expression pattern
of 3 miRNAs was consistently repressed in kidney renal cell carcinoma (KIRC) and prostate adenocarcinoma (PRAD), none were statistically significant. An up-
regulated expression pattern was observed for the 3 miRNAs in head and neck squamous cell carcinoma (HNSC), lung adenocarcinoma (LUAD) and stomach
adenocarcinoma (STAD), but also no significant difference. Both up- and down-regulation patterns were obtained for the 3 miRNAs in female breast invasive
carcinoma (BRCA), lung squamous cell carcinoma (LUSC) and thyroid carcinoma (THCA), suggesting their tumor specificity
Hepatoma Research | Volume 2 | June 1, 2016 157