
Page 165 - Read Online
P. 165
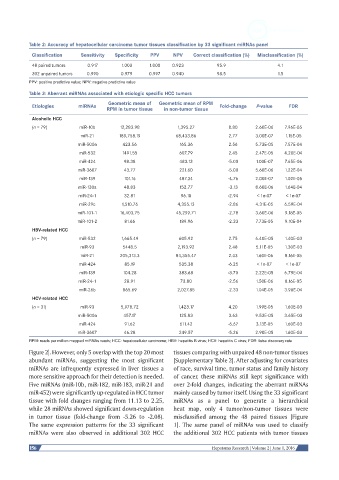
Table 2: Accuracy of hepatocellular carcinoma tumor tissues classification by 33 significant miRNAs panel
            Classification   Sensitivity  Specificity  PPV    NPV    Correct classification (%)  Misclassification (%)

            48 paired tumors    0.917       1.000    1.000    0.923          95.9                 4.1
            302 unpaired tumors  0.990      0.979    0.997    0.940          98.5                 1.5
           PPV: positive predictive value; NPV: negative predictive value
           Table 3: Aberrant miRNAs associated with etiologic specific HCC tumors
                                       Geometric mean of   Geometric mean of RPM
            Etiologies       miRNAs                                           Fold-change  P-value    FDR
                                       RPM in tumor tissue  in non-tumor tissue
            Alcoholic HCC
            (n = 79)         miR-10b       12,283.98           1,395.27          8.80      2.60E-06  7.96E-05
                             miR-21        189,758.19          68,433.86         2.77      3.00E-07  1.15E-05
                            miR-500a        423.56              165.36           2.56      5.73E-05  7.57E-04
                             miR-532        1491.55             607.79           2.45      2.47E-05  4.20E-04
                             miR-424         98.38              483.13           -5.00     1.00E-07  7.65E-06
                            miR-3607         43.77              221.60           -5.00     5.60E-06  1.22E-04
                             miR-139         101.16             487.34           -4.76     2.00E-07  1.02E-05
                            miR-130a         48.83              152.77           -3.13     8.60E-06  1.64E-04
                             miR-24-1        32.81               96.18           -2.94     < 1e-07   < 1e-07
                             miR-29c        1,510.76           4,355.13          -2.86     4.31E-05  6.59E-04
                            miR-101-1      16,403.75           45,299.71         -2.78     3.60E-06  9.18E-05
                            miR-101-2        81.66              189.96           -2.33     7.73E-05  9.10E-04
            HBV-related HCC
            (n = 79)         miR-532        1,665.49            605.92           2.75      6.40E-05  1.40E-03
                             miR-93         5448.5             2,193.92          2.48      5.11E-05  1.30E-03
                             miR-21        205,313.3           84,355.47         2.43      1.60E-06  8.16E-05
                             miR-424         85.19              535.38           -6.25     < 1e-07   < 1e-07
                             miR-139        104.28              383.68           -3.70     2.22E-05  6.79E-04
                             miR-24-1        28.91              73.80            -2.56     1.50E-06  8.16E-05
                             miR-26b        865.69             2,027.85          -2.33     1.04E-05  3.98E-04
            HCV-related HCC
            (n = 31)         miR-93        5,978.72            1,423.17          4.20      1.99E-05  1.60E-03
                            miR-500a        457.17              125.83           3.63      9.53E-05  3.65E-03
                             miR-424         91.62              611.42           -6.67     3.13E-05  1.60E-03
                            miR-3607         46.28              249.57           -5.26     2.90E-05  1.60E-03
           RPM: reads per million mapped miRNAs reads; HCC: hepatocellular carcinoma; HBV: hepatitis B virus; HCV: hepatitis C virus; FDR: false discovery rate
           Figure 2]. However, only 5 overlap with the top 20 most   tissues comparing with unpaired 48 non-tumor tissues
           abundant  miRNAs,  suggesting  the  most  significant   [Supplementary Table 2]. After adjusting for covariates
           miRNAs are infrequently expressed in liver tissues a   of race, survival time, tumor status and family history
           more sensitive approach for their detection is needed.   of cancer, these miRNAs still kept significance with
           Five miRNAs (miR-10b, miR-182, miR-183, miR-21 and   over 2-fold changes, indicating the aberrant miRNAs
           miR-452) were significantly up-regulated in HCC tumor   mainly caused by tumor itself. Using the 33 significant
           tissue with fold changes ranging from 11.13 to 2.25,   miRNAs  as a panel to generate  a hierarchical
           while 28 miRNAs showed significant down-regulation   heat map, only 4 tumor/non-tumor tissues  were
           in tumor tissue (fold-change from -5.26 to -2.08).   misclassified among the 48 paired tissues  [Figure
           The same expression patterns for the 33 significant   1].  The same panel of miRNAs was used to classify
           miRNAs were also observed in additional 302 HCC    the additional 302 HCC patients with tumor tissues

           156                                                              Hepatoma Research | Volume 2 | June 1, 2016