
Page 164 - Read Online
P. 164
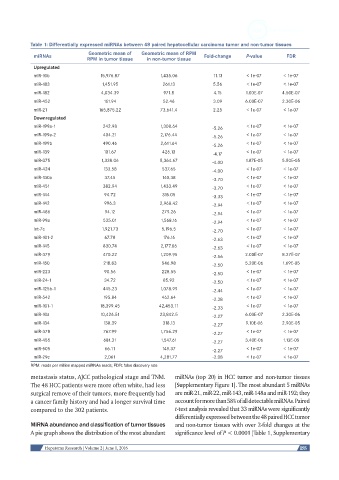
Table 1: Differentially expressed miRNAs between 48 paired hepatocellular carcinoma tumor and non-tumor tissues
                                Geometric mean of   Geometric mean of RPM
             miRNAs                                                      Fold-change   P-value        FDR
                                RPM in tumor tissue  in non-tumor tissue
             Upregulated
             miR-10b                15,976.87            1,435.06           11.13       < 1e-07      < 1e-07
             miR-183                 1,451.95             261.13            5.56        < 1e-07      < 1e-07
             miR-182                 4,034.39             971.8             4.15       1.00E-07     4.50E-07
             miR-452                 161.94               52.46             3.09       6.00E-07     2.30E-06
             miR-21                 165,875.22           73,641.4           2.25        < 1e-07      < 1e-07
             Downregulated
             miR-199a-1              242.98              1,308.64           -5.26       < 1e-07      < 1e-07
             miR-199a-2              404.21              2,176.44           -5.26       < 1e-07      < 1e-07
             miR-199b                490.46              2,611.64           -5.26       < 1e-07      < 1e-07
             miR-139                 101.67               426.13            -4.17       < 1e-07      < 1e-07
             miR-375                 1,338.06            5,364.67           -4.00      1.87E-05     5.50E-05
             miR-424                 133.58               537.65            -4.00       < 1e-07      < 1e-07
             miR-130a                 37.45               140.38            -3.70       < 1e-07      < 1e-07
             miR-451                 382.94              1,433.49           -3.70       < 1e-07      < 1e-07
             miR-144                  94.72               315.05            -3.33       < 1e-07      < 1e-07
             miR-142                  996.3              2,968.42           -2.94       < 1e-07      < 1e-07
             miR-486                  94.12               279.26            -2.94       < 1e-07      < 1e-07
             miR-99a                 535.01              1,568.16           -2.94       < 1e-07      < 1e-07
             let-7c                  1,921.73             5,196.5           -2.70       < 1e-07      < 1e-07
             miR-101-2                67.78               176.16            -2.63       < 1e-07      < 1e-07
             miR-145                 830.74              2,177.06           -2.63       < 1e-07      < 1e-07
             miR-379                 470.22              1,209.95           -2.56      2.00E-07     8.27E-07
             miR-150                 218.83               546.98            -2.50      5.20E-06     1.69E-05
             miR-223                  90.56               228.55            -2.50       < 1e-07      < 1e-07
             miR-24-1                 34.72               85.92             -2.50       < 1e-07      < 1e-07
             miR-125b-1              445.23              1,078.99           -2.44       < 1e-07      < 1e-07
             miR-542                 195.84               462.64            -2.38       < 1e-07      < 1e-07
             miR-101-1              18,399.45            42,453.11          -2.33       < 1e-07      < 1e-07
             miR-10a                10,426.51            23,842.5           -2.27      6.00E-07     2.30E-06
             miR-134                 138.39               318.13            -2.27      9.10E-06     2.90E-05
             miR-378                 767.99              1,756.29           -2.27       < 1e-07      < 1e-07
             miR-455                 681.31              1,547.61           -2.27      3.40E-06     1.13E-05
             miR-505                  66.11               149.37            -2.27       < 1e-07      < 1e-07
             miR-29c                  2,061              4,281.77           -2.08       < 1e-07      < 1e-07
            RPM: reads per million mapped miRNAs reads; FDR: false discovery rate
            metastasis status, AJCC pathological stage and TNM.   miRNAs (top 20) in HCC tumor and non-tumor tissues
            The 48 HCC patients were more often white, had less   [Supplementary Figure 1]. The most abundant 5 miRNAs
            surgical remove of their tumors, more frequently had   are miR-21, miR-22, miR-143, miR-148a and miR-192; they
            a cancer family history and had a longer survival time   account for more than 58% of all detectable miRNAs. Paired
            compared to the 302 patients.                      t-test analysis revealed that 33 miRNAs were significantly
                                                               differentially expressed between the 48 paired HCC tumor
            MiRNA abundance and classification of tumor tissues  and non-tumor tissues with over 2-fold changes at the
            A pie graph shows the distribution of the most abundant   significance level of P < 0.0001 [Table 1, Supplementary


                 Hepatoma Research | Volume 2 | June 1, 2016                                              155