
Page 163 - Read Online
P. 163
one type of tumor is opposite to all others, we also imis.athena-innovation.gr/DianaTools/index.php),
define them as “tumor type specific” miRNAs. The most miRanda (http://www.microrna.org/microrna/home.
commonly or uniquely expressed miRNAs were selected do), mirBridge (http://mirbridge.org/), PicTar (http://
as “tumor common” or “tumor type specific” markers, pictar.mdc-berlin.de/), PITA (http://genie. weizmann.
respectively, for further bioinformatics validation. ac.il/pubs/mir07/mir07_data.html), RNA22 (https://
cm.jefferson.edu/rna22v2/), and TargetScan v6.2
All statistical data analyses were performed using (http://www.targetscan.org/). The concordant targets in
BRB-ArrayTools (version 4.4) developed by Dr. Richard the current study were defined as genes predicted by
Simon and the BRB-ArrayTools Development Team at least 5 out of 7 algorithms or validated by functional
(http://linus.nci.nih.gov/BRB-ArrayTools.html) [18] experiment. These genes were the most likely miRNA
and Statistical Analysis System 9.0 (SAS Institute). targets that were further evaluated by ToppGene
TCGA data used in this study meet the publication (https://toppgene.cchmc.org/prioritization.jsp) to
[20]
guidelines provided by TCGA (http://cancergenome. identify significant biological processes, pathways,
nih.gov/publications/publicationguidelines). molecular functions and cellular components after
Bonferroni correction P < 0.05.
Bioinformatics analyses of miRNA targets and
pathways enrichment RESULTS
The targets of the miRNAs were predicted by
mirsystem, which integrates seven well known Demographic and clinical characteristics of HCC patients
miRNA target gene prediction programs (http:// We compared the demographic and clinical
mirsystem.cgm.ntu.edu.tw/index.php), as well characteristics between 48 HCC patients with paired
[19]
as the experimentally validated miRNA-target data tumor and non-tumor tissues, and 302 patients with
from miRecords (http://c1.accurascience. com/ tumor tissue alone [Supplementary Table 1]. There
miRecords/) and TarBase (http://www.hsls.pitt.edu/ were no significant differences for the co-variates of
obrc/index.php?page= URL1237572545). The age (means of 61.1 vs. 59.5 years), gender, etiology,
seven predictive tools include DIANA (http://diana. BMI, AFP level, tumor grade, lymph node involvement,
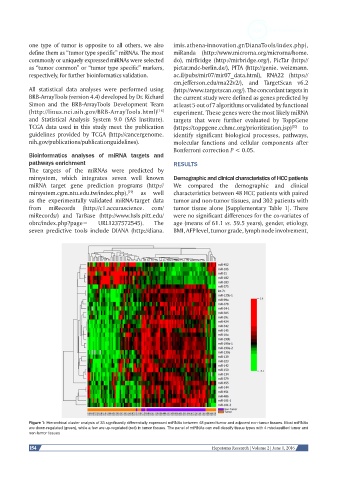
Figure 1: Hierarchical cluster analysis of 33 significantly differentially expressed miRNAs between 48 paired tumor and adjacent non-tumor tissues. Most miRNAs
are down-regulated (green), while a few are up-regulated (red) in tumor tissues. The panel of miRNAs can well classify tissue types with 4 misclassified tumor and
non-tumor tissues
154 Hepatoma Research | Volume 2 | June 1, 2016