
Page 51 - Read Online
P. 51
860 g for 20 min. The separated sera were frozen at -20 °C Histopathological studies
for further analysis. The rats were dissected and the livers Liver specimens were carefully fixed in neutral formalin
were immediately excised, rinsed with ice-cold saline, solution (10%), dehydrated in ascending grades of ethanol,
blotted dry, and accurately weighed. They were then minced cleared in xylene, embedded in a paraffin wax, sectioned at
and homogenized in ice-cold buffered saline (10% w/v). The 5-7 μm, and stained with hematoxylin and eosin (HE). The
homogenates were centrifuged at 860 g for 10 min at 4 °C. stained sections were examined and photographed under a
[32]
Finally, the supernatants were subjected to biochemical light microscope to detect its histopathological properties.
analysis. Other samples of the liver tissue were stored in 10% In addition to the routine H and E stain, Masson’s trichrome
neutral formalin for histopathological studies. stains (a three-color staining protocol used in histology,
where connective tissue is stained blue, nuclei are stained
Biochemical analysis dark red/purple, and cytoplasm is stained red/pink) were
Total lipid, total cholesterol (TC), triglycerides (TGs), and employed for identification of collagen fibers, a good marker
high-density lipoprotein cholesterol (HDL-C) levels were for various diseases such as fibrosis. [33]
quantified using kits supplied by Spinreact S.A. (Sant Esteve de
Bas, Spain). [18-21] Low-density lipoprotein cholesterol (LDL-C) Statistical analysis
and very low-density lipoprotein cholesterol (VLDL-C) levels Results were expressed as a mean ± standard error of mean
were calculated according to the following equations, (SEM). Statistical significance was calculated using one-way
analysis of variance followed by Duncan’s multiple range test.
[34]
LDL-C = TC - HDL-C - TG/5 and VLDL-C = TG/5. [23]
[22]
All of the statistical analyses were carried out with the use of
SPSS 12.00 software, SPSS (Hong Kong) Ltd, Quarry Bay, Hong
Alpha-fetoprotein (AFP) levels in serum was estimated by Kong. Differences were considered significant at P ≤ 0.05.
the method described previously through kits purchased
from the Diagnostic Products Company (Los Angeles, CA, RESULTS
[24]
USA). Total protein, albumin, and total bilirubin levels
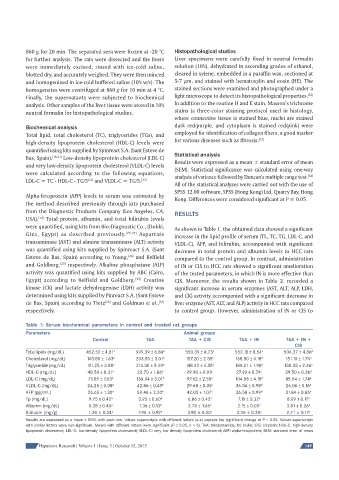
were quantified, using kits from Bio-Diagnostic Co., (Dokki, As shown in Table 1, the obtained data showed a significant
Giza, Egypt) as described previously. [25-27] Aspartate increase in the lipid profile of serum ( TL, TC, TG, LDL-C, and
transaminase (AST) and alanine transaminase (ALT) activity VLDL-C), AFP, and bilirubin, accompanied with significant
was quantified using kits supplied by Spinreact S.A. (Sant decrease in total protein and albumin levels in HCC rats
Esteve de Bas, Spain) according to Young, and Belfield compared to the control group. In contrast, administration
[28]
and Goldberg, respectively. Alkaline phosphatase (ALP) of IN or CIS to HCC rats showed a significant amelioration
[29]
activity was quantified using kits supplied by ABC (Cairo, of the tested parameters, in which IN is more effective than
Egypt) according to Belfield and Goldberg. [29] Creatine CIS. Moreover, the results shown in Table 2, recorded a
kinase (CK) and lactate dehydrogenase (LDH) activity was significant increase in serum enzymes (AST, ALT, ALP, LDH,
determined using kits supplied by Pinreact S.A. (Sant Esteve and CK) activity accompanied with a significant decrease in
de Bas, Spain) according to Tietz and Goldman et al., liver enzyme (AST, ALT, and ALP) activity in HCC rats compared
[31]
[30]
respectively. to control group. However, administration of IN or CIS to
Table 1: Serum biochemical parameters in control and treated rat groups
Parameters Animal groups
Control TAA TAA + CIS TAA + IN TAA + IN +
CIS
Total lipids (mg/dL) 452.52 ± 4.81 a 599.39 ± 6.86 b 550.39 ± 8.73 c 552.18 ± 8.54 c 504.37 ± 4.86 d
Cholesterol (mg/dL) 143.80 ± 1.63 a 203.50 ± 3.01 b 157.20 ± 2.55 c 168.50 ± 4.18 d 151.10 ± 1.74 a
Triglyceride (mg/dL) 121.25 ± 3.88 a 214.30 ± 5.49 b 148.42 ± 4.35 c 180.21 ± 1.98 d 130.33 ± 2.66 e
HDL-C (mg/dL) 48.50 ± 0.31 a 23.70 ± 1.86 b 29.90 ± 0.93 c 27.90 ± 0.74 c 39.50 ± 0.36 d
LDL-C (mg/dL) 71.05 ± 1.63 a 136.94 ± 3.01 b 97.62 ± 2.55 c 104.56 ± 4.18 d 85.54 ± 1.74 e
VLDL-C (mg/dL) 24.25 ± 0.08 a 42.86 ± 0.49 b 29.68 ± 0.35 c 36.04 ± 0.98 d 26.06 ± 0.16 a
AFP (pg/mL) 26.65 ± 1.30 a 59.46 ± 3.20 b 42.05 ± 1.07 c 36.58 ± 0.99 d 31.84 ± 0.65 e
Tp (mg/dL) 9.75 ± 0.42 a 3.95 ± 0.60 b 6.86 ± 0.43 c 7.15 ± 0.32 c 8.99 ± 0.17 a
Albumin (mg/dL) 5.28 ± 0.45 a 1.36 ± 0.13 b 2.70 ± 1.65 c 2.15 ± 0.09 c 3.81 ± 0.26 d
Bilirubin (mg/g) 1.30 ± 0.24 a 7.95 ± 0.92 b 3.90 ± 0.20 c 3.35 ± 0.20 c 2.71 ± 0.17 c
Results are expressed as a mean ± SEM, with each row. Values superscripts with different letters (a-e) express the signifi cant change at P ≤ 0.05. Values superscripts
with similar letters were non-signifi cant. Means with different letters were signifi cant (P ≤ 0.05, n = 6). TAA: thioacetamide; IN: inulin; CIS: cisplatin; HDL-C: high-density
lipoprotein cholesterol; LDL-C: low-density lipoprotein cholesterol; VLDL-C: very low density lipoprotein cholesterol; AFP: alpha-fetoprotein; SEM: standard error of mean
Hepatoma Research | Volume 1 | Issue 3 | October 15, 2015 149