
Page 44 - Read Online
P. 44
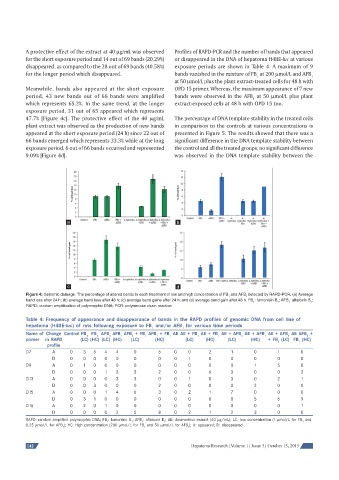
A protective effect of the extract at 40 μg/mL was observed   Profiles of RAPD-PCR and the number of bands that appeared
          for the short exposure period and 14 out of 69 bands (20.29%)   or disappeared in the DNA of hepatoma H4IIE-luc at various
          disappeared, as compared to the 28 out of 69 bands (40.58%)   exposure periods are shown in Table 4. A maximum of 9
          for the longer period which disappeared.            bands vanished in the mixture of FB  at 200 μmol/L and AFB
                                                                                                              1
                                                                                           1
                                                              at 50 μmol/L plus the plant extract-treated cells for 48 h with
          Meanwhile, bands also appeared at the short exposure   OPD 15 primer. Whereas, the maximum appearance of 7 new
          period, 43 new bands out of 66 bands were amplified   bands were observed in the AFB  at 50 μmol/L plus plant
                                                                                          1
          which represents 65.2%. In the same trend, at the longer   extract-exposed cells at 48 h with OPD 15 too.
          exposure period, 31 out of 65 appeared which represents
          47.7% [Figure 4c]. The protective effect of the 40 μg/mL   The percentage of DNA template stability in the treated cells
          plant extract was observed as the production of new bands   in comparison to the controls at various concentrations is
          appeared at the short exposure period (24 h) since 22 out of   presented in Figure 5. The results showed that there was a
          66 bands emerged which represents 33.3% while at the long   significant difference in the DNA template stability between
          exposure period, 6 out of 66 bands occurred and represented   the control and all the treated groups, no significant difference
          9.09% [Figure 4d].                                  was observed in the DNA template stability between the


                         a                                     b


                         c                                     d
          Figure 4: Genomic damage. The percentage of altered bands in each treatment of low and high concentration of FB  and AFB detected by RAPD-PCR. (a) Average
                                                                                 1
                                                                                       1
          band loss after 24 h; (b) average band loss after 48 h; (c) average band gains after 24 h; and (d) average band gain after 48 h. FB : fumonisin B ; AFB : afl atoxin B ;
                                                                                                      1
                                                                                                              1
                                                                                                  1
                                                                                          1
          RAPD: random amplifi cation of polymorphic DNA; PCR: polymerase chain reaction
          Table 4: Frequency of appearance and disappearance of bands in the RAPD profi les of genomic DNA from cell line of
          hepatoma (H4IIE-luc) of rats following exposure to FB  and/or AFB  for various time periods
                                                      1          1
          Name of  Change  Control FB   FB   AFB  AFB  AFB  + FB  AFB  + FB  AE AE + FB  AE + FB  AE + AFB  AE + AFB  AE + AFB   AE AFB  +
                               1   1   1   1   1    1   1    1        1      1        1       1       1      1
          primer  in RAPD    (LC) (HC) (LC) (HC)  (LC)  (HC)      (LC)   (HC)    (LC)    (HC)  + FB  (LC) FB  (HC)
                                                                                                   1      1
                  profi le
          D7       A      0   3   5   4   4     0        6    0    0      2       1       0       1        0
                   D      0   0   0   0   0     0        0    0    1      0       0       0       0        0
          D9       A      0   1   0   0   0     0        0    0    0      0       0       1       5        0
                   D      0   0   0   1   3     3        2    0    0      6       3       0       0        2
          D13      A      0   0   0   0   3     3        0    0    1      0       3       0       2        1
                   D      0   0   3   0   0     0        2    0    0      0       0       2       0        0
          D15      A      0   0   0   1   4     6        3    0    2      1       7       0       0        0
                   D      0   3   1   0   0     0        0    0    0      0       0       5       6        9
          D16      A      0   2   0   1   0     0        0    0    0      0       0       0       0        1
                   D      0   0   0   0   2     5        8    0    2      1       2       3       0        0
          RAPD: random amplifi ed polymorphic DNA; FB : fumonisin B ; AFB : afl atoxin B ; AE: Amaranthus extract (40 μg/mL); LC: low concentration (1 μmol/L for FB  and
                                       1       1   1       1                                               1
          0.25 μmol/L for AFB ); HC: high concentration (200 μmol/L for FB  and 50 μmol/L for AFB ); A: appeared; D: disappeared
                       1                            1              1
          142                                                       Hepatoma Research | Volume 1 | Issue 3 | October 15, 2015