
Page 43 - Read Online
P. 43
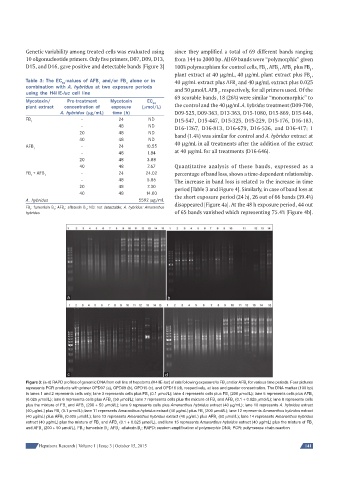
Genetic variability among treated cells was evaluated using   since they amplified a total of 69 different bands ranging
          10 oligonucleotide primers. Only five primers, D07, D09, D13,   from 144 to 2000 bp. All 69 bands were “polymorphic” given
          D15, and D16, gave positive and detectable bands [Figure 3]   100% polymorphism for control cells, FB , AFB , AFB  plus FB ,
                                                                                              1    1   1      1
                                                              plant extract at 40 μg/mL, 40   μg/mL plant extract plus FB ,
                                                                                                              1
          Table 3: The EC -values of AFB  and/or FB  alone or in   40 μg/mL extract plus AFB  and 40 μg/mL extract plus 0.025
                       50           1        1                                      1
          combination with A. hybridus at two exposure periods   and 50 μmol/L AFB , respectively, for all primers used. Of the
          using the H4IIE-luc cell line                                      1
                                                              69 scorable bands, 18 (26%) were similar “monomorphic” to
          Mycotoxin/     Pre-treatment   Mycotoxin   EC
                                                       50     the control and the 40 μg/mL A. hybridus treatment (D09-700,
          plant extract  concentration of   exposure   (μmol/L)
                      A. hybridus (μg/mL)  time (h)           D09-525, D09-363, D13-363, D15-1080, D15-869, D15-646,
          FB                  -            24        ND       D15-547, D15-447, D15-325, D15-229, D15-176, D16-183,
            1
                              -            48        ND       D16-1267, D16-813, D16-679, D16-536, and D16-417; 1
                             20            48        ND
                                                              band (1.4%) was similar for control and A. hybridus extract at
                             40            48        ND
                                                              40 μg/mL in all treatments after the addition of the extract
          AFB                 -            24       10.55
             1                                                at 40 μg/mL for all treatments (D16-646).
                              -            48        1.84
                             20            48        3.88
                             40            48        7.67     Quantitative analysis of these bands, expressed as a
          FB + AFB            -            24       24.02     percentage of band loss, shows a time-dependent relationship.
            1    1
                              -            48        5.86     The increase in band loss is related to the increase in time
                             20            48        7.30
                                                              period [Table 3 and Figure 4]. Similarly, in case of band loss at
                             40            48       14.00     the short exposure period (24 h), 26 out of 66 bands (39.4%)
          A. hybridus                             5592 μg/mL
                                                              disappeared [Figure 4a]. At the 48 h exposure period, 44 out
          FB : fumonisin B ; AFB : afl atoxin B ; ND: not detectable; A. hybridus: Amaranthus
            1       1  1       1
          hybridus                                            of 65 bands vanished which representing 75.4% [Figure 4b].


                         a                                  b


                         c                                 d
          Figure 3: (a-d) RAPD profi les of genomic DNA from cell line of hepatoma (H4IIE-luc) of rats following exposure to FB and/or AFB  for various time periods. Four pictures
                                                                                       1
                                                                                1
          represents PCR products with primer OPD07 (a), OPD09 (b), OPD15 (c), and OPD16 (d), respectively, at less and greater concentration. The DNA marker (100 bp)
          in lanes 1 and 2 represents cells only; lane 3 represents cells plus FB  (0.1 μmol/L); lane 4 represents cells plus FB  (200 μmol/L); lane 5 represents cells plus AFB
                                                                                                              1
                                                                                 1
                                                     1
          (0.025 μmol/L); lane 6 represents cells plus AFB  (50 μmol/L); lane 7 represents cells plus the mixture of FB  and AFB  (0.1 + 0.025 μmol/L); lane 8 represents cells
                                                                                   1
                                                                             1
                                        1
          plus the mixture of FB  and AFB  (200 + 50 μmol/L); lane 9 represents cells plus Amaranthus hybridus extract (40 μg/mL); lane 10 represents A. hybridus extract
                        1
                              1
          (40 μg/mL) plus FB  (0.1 μmol/L); lane 11 represents Amaranthus hybridus extract (40 μg/mL) plus FB  (200 μmol/L); lane 12 represents Amaranthus hybridus extract
                                                                        1
                      1
          (40 μg/mL) plus AFB  (0.025 μmol/L); lane 13 represents Amaranthus hybridus extract (40 μg/mL) plus AFB  (50 μmol/L); lane 14 represents Amaranthus hybridus
                                                                             1
                       1
          extract (40 μg/mL) plus the mixture of FB  and AFB  (0.1 + 0.025 μmol/L), and lane 15 represents Amaranthus hybridus extract (40 μg/mL) plus the mixture of FB
                                          1
                                                                                                              1
                                    1
          and AFB  (200 + 50 μmol/L). FB : fumonisin B ; AFB : afl atoxin B ; RAPD: random amplifi cation of polymorphic DNA; PCR: polymerase chain reaction
                                                  1
                                          1
                              1
                                       1
                1
               Hepatoma Research | Volume 1 | Issue 3 | October 15, 2015                                    141