
Page 34 - Read Online
P. 34
Kobayashi et al. Hepatoma Res 2020;6:36 I http://dx.doi.org/10.20517/2394-5079.2020.24 Page 9 of 14
A B C
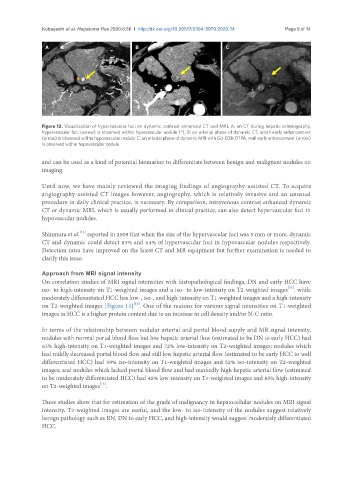
Figure 12. Visualization of hypervascular foci on dynamic contrast enhanced CT and MRI. A: on CT during hepatic arteriography,
hypervascular foci (arrow) is observed within hypovascular nodule (*); B: on arterial phase of dynamic CT, small early enhancement
(arrow) is observed within hypovascular nodule; C: on arterial phase of dynamic MRI with Gd-EOB-DTPA, mall early enhancement (arrow)
is observed within hypovascular nodule
and can be used as a kind of potential biomarker to differentiate between benign and malignant nodules on
imaging.
Until now, we have mainly reviewed the imaging findings of angiography-assisted CT. To acquire
angiography-assisted CT images however, angiography, which is relatively invasive and an unusual
procedure in daily clinical practice, is necessary. By comparison, intravenous contrast enhanced dynamic
CT or dynamic MRI, which is usually performed in clinical practice, can also detect hypervascular foci in
hypovascular nodules.
[12]
Shinmura et al. reported in 2008 that when the size of the hypervascular foci was 5 mm or more, dynamic
CT and dynamic could detect 83% and 64% of hypervascular foci in hypovascular nodules respectively.
Detection rates have improved on the latest CT and MR equipment but further examination is needed to
clarify this issue.
Approach from MRI signal intensity
On correlation studies of MRI signal intensities with histopathological findings, DN and early HCC have
[13]
iso- to high-intensity on T1-weighted images and a iso- to low-intensity on T2-weighted images . while
moderately differentiated HCC has low-, iso-, and high-intensity on T1-weighted images and a high-intensity
[14]
on T2-weighted images [Figure 13] . One of the reasons for various signal intensities on T1-weighted
images in HCC is a higher protein content due to an increase in cell density and/or N-C ratio.
In terms of the relationship between nodular arterial and portal blood supply and MR signal intensity,
nodules with normal portal blood flow but low hepatic arterial flow (estimated to be DN to early HCC) had
63% high-intensity on T1-weighted images and 72% low-intensity on T2-weighted images; nodules which
had mildly decreased portal blood flow and still low hepatic arterial flow (estimated to be early HCC to well
differentiated HCC) had 39% iso-intensity on T1-weighted images and 52% iso-intensity on T2-weighted
images; and nodules which lacked portal blood flow and had markedly high hepatic arterial flow (estimated
to be moderately differentiated HCC) had 48% low-intensity on T1-weighted images and 85% high-intensity
[15]
on T2-weighted images .
These studies show that for estimation of the grade of malignancy in hepatocellular nodules on MRI signal
intensity, T2-weighted images are useful, and the low- to iso-intensity of the nodules suggest relatively
benign pathology such as RN, DN to early HCC, and high-intensity would suggest moderately differentiated
HCC.