
Page 41 - Read Online
P. 41
Page 16 of 23 Shanmugasundaram et al. Energy Mater. 2025, 5, 500100 https://dx.doi.org/10.20517/energymater.2024.304
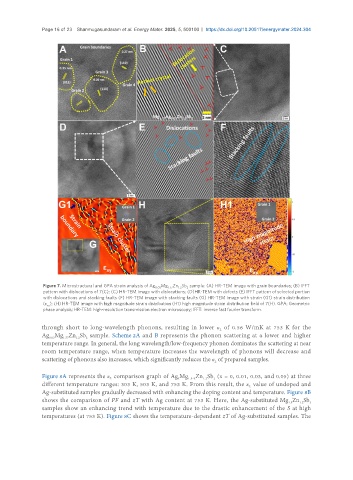
Figure 7. Microstructural and GPA strain analysis of Ag Mg Zn Sb sample: (A) HR-TEM image with grain boundaries; (B) IFFT
0.03 1.77 1.2 2
pattern with dislocations of 7(C); (C) HR-TEM image with dislocations; (D)HR-TEM with defects (E) IFFT pattern of selected portion
with dislocations and stacking faults (F) HR-TEM image with stacking faults (G) HR-TEM image with strain (G1) strain distribution
(ε ); (H) HR-TEM image with high magnitude strain distribution (H1) high magnitude strain distribution field of 7(H). GPA: Geometric
xy
phase analysis; HR-TEM: high-resolution transmission electron microscopy; IFFT: inverse fast fourier transform.
through short to long-wavelength phonons, resulting in lower κ of 0.56 W/mK at 753 K for the
L
Ag Mg Zn Sb sample. Scheme 2A and B represents the phonon scattering at a lower and higher
0.03
1.77
2
1.2
temperature range. In general, the long wavelength/low-frequency phonon dominates the scattering at near
room temperature range, when temperature increases the wavelength of phonons will decrease and
scattering of phonons also increases, which significantly reduces the κ of prepared samples.
L
Figure 8A represents the κ comparison graph of Ag Mg Zn Sb (x = 0, 0.01, 0.03, and 0.05) at three
1.8-x
x
2
1.2
L
different temperature ranges: 303 K, 503 K, and 753 K. From this result, the κ value of undoped and
L
Ag-substituted samples gradually decreased with enhancing the doping content and temperature. Figure 8B
shows the comparison of PF and zT with Ag content at 753 K. Here, the Ag-substituted Mg Zn Sb
1.8
1.2
2
samples show an enhancing trend with temperature due to the drastic enhancement of the S at high
temperatures (at 753 K). Figure 8C shows the temperature-dependent zT of Ag-substituted samples. The