
Page 210 - Read Online
P. 210
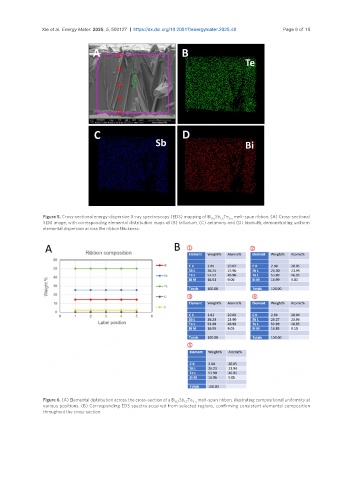
Xie et al. Energy Mater. 2025, 5, 500127  https://dx.doi.org/10.20517/energymater.2025.48  Page 9 of 15


                Figure 5. Cross-sectional energy-dispersive X-ray spectroscopy (EDS) mapping of Bi Sb Te  melt-spun ribbon. (A) Cross-sectional
                                                                        0.5  1.5  3-x
                SEM image, with corresponding elemental distribution maps of (B) tellurium, (C) antimony and (D) bismuth, demonstrating uniform
                elemental dispersion across the ribbon thickness.


                Figure 6. (A) Elemental distribution across the cross-section of a Bi Sb Te  melt-spun ribbon, illustrating compositional uniformity at
                                                               1.5
                                                            0.5
                                                                  3-x
                various positions. (B) Corresponding EDS spectra acquired from selected regions, confirming consistent elemental composition
                throughout the cross-section.