
Page 208 - Read Online
P. 208
Xie et al. Energy Mater. 2025, 5, 500127 https://dx.doi.org/10.20517/energymater.2025.48 Page 7 of 15
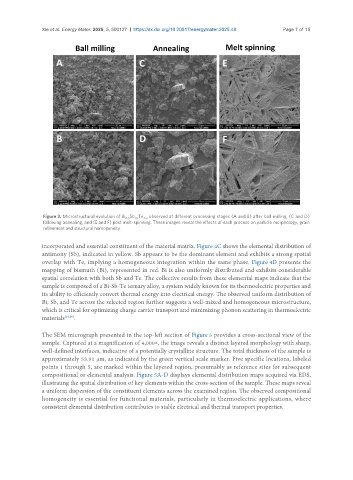
Figure 3. Microstructural evolution of Bi Sb Te observed at different processing stages (A and B) after ball milling, (C and D)
1.5
0.5
3-x
following annealing, and (E and F) post melt-spinning. These images reveal the effects of each process on particle morphology, grain
refinement and structural homogeneity.
incorporated and essential constituent of the material matrix. Figure 4C shows the elemental distribution of
antimony (Sb), indicated in yellow. Sb appears to be the dominant element and exhibits a strong spatial
overlap with Te, implying a homogeneous integration within the same phase. Figure 4D presents the
mapping of bismuth (Bi), represented in red. Bi is also uniformly distributed and exhibits considerable
spatial correlation with both Sb and Te. The collective results from these elemental maps indicate that the
sample is composed of a Bi-Sb-Te ternary alloy, a system widely known for its thermoelectric properties and
its ability to efficiently convert thermal energy into electrical energy. The observed uniform distribution of
Bi, Sb, and Te across the selected region further suggests a well-mixed and homogeneous microstructure,
which is critical for optimizing charge carrier transport and minimizing phonon scattering in thermoelectric
materials [29,30] .
The SEM micrograph presented in the top-left section of Figure 5 provides a cross-sectional view of the
sample. Captured at a magnification of 4,000×, the image reveals a distinct layered morphology with sharp,
well-defined interfaces, indicative of a potentially crystalline structure. The total thickness of the sample is
approximately 53.91 μm, as indicated by the green vertical scale marker. Five specific locations, labeled
points 1 through 5, are marked within the layered region, presumably as reference sites for subsequent
compositional or elemental analysis. Figure 5A-D displays elemental distribution maps acquired via EDS,
illustrating the spatial distribution of key elements within the cross-section of the sample. These maps reveal
a uniform dispersion of the constituent elements across the examined region. The observed compositional
homogeneity is essential for functional materials, particularly in thermoelectric applications, where
consistent elemental distribution contributes to stable electrical and thermal transport properties.