
Page 212 - Read Online
P. 212
Xie et al. Energy Mater. 2025, 5, 500127 https://dx.doi.org/10.20517/energymater.2025.48 Page 11 of 15
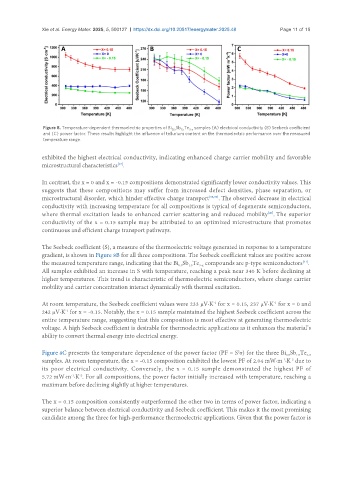
Figure 8. Temperature-dependent thermoelectric properties of Bi Sb Te samples (A) electrical conductivity (B) Seebeck coefficient
0.5 1.5 3-x
and (C) power factor. These results highlight the influence of tellurium content on the thermoelectric performance over the measured
temperature range.
exhibited the highest electrical conductivity, indicating enhanced charge carrier mobility and favorable
[37]
microstructural characteristics .
In contrast, the x = 0 and x = -0.15 compositions demonstrated significantly lower conductivity values. This
suggests that these compositions may suffer from increased defect densities, phase separation, or
microstructural disorder, which hinder effective charge transport [38,39] . The observed decrease in electrical
conductivity with increasing temperature for all compositions is typical of degenerate semiconductors,
[40]
where thermal excitation leads to enhanced carrier scattering and reduced mobility . The superior
conductivity of the x = 0.15 sample may be attributed to an optimized microstructure that promotes
continuous and efficient charge transport pathways.
The Seebeck coefficient (S), a measure of the thermoelectric voltage generated in response to a temperature
gradient, is shown in Figure 8B for all three compositions. The Seebeck coefficient values are positive across
the measured temperature range, indicating that the Bi Sb Te compounds are p-type semiconductors .
[41]
3-x
1.5
0.5
All samples exhibited an increase in S with temperature, reaching a peak near 340 K before declining at
higher temperatures. This trend is characteristic of thermoelectric semiconductors, where charge carrier
mobility and carrier concentration interact dynamically with thermal excitation.
-1
At room temperature, the Seebeck coefficient values were 233 µV·K for x = 0.15, 237 µV·K for x = 0 and
-1
242 µV·K for x = -0.15. Notably, the x = 0.15 sample maintained the highest Seebeck coefficient across the
-1
entire temperature range, suggesting that this composition is most effective at generating thermoelectric
voltage. A high Seebeck coefficient is desirable for thermoelectric applications as it enhances the material’s
ability to convert thermal energy into electrical energy.
Figure 8C presents the temperature dependence of the power factor (PF = S σ) for the three Bi Sb Te
2
3-x
1.5
0.5
-1
samples. At room temperature, the x = -0.15 composition exhibited the lowest PF of 2.04 mW·m ·K due to
-2
its poor electrical conductivity. Conversely, the x = 0.15 sample demonstrated the highest PF of
5.72 mW·m ·K . For all compositions, the power factor initially increased with temperature, reaching a
-2
-1
maximum before declining slightly at higher temperatures.
The x = 0.15 composition consistently outperformed the other two in terms of power factor, indicating a
superior balance between electrical conductivity and Seebeck coefficient. This makes it the most promising
candidate among the three for high-performance thermoelectric applications. Given that the power factor is