
Page 206 - Read Online
P. 206
Xie et al. Energy Mater. 2025, 5, 500127 https://dx.doi.org/10.20517/energymater.2025.48 Page 5 of 15
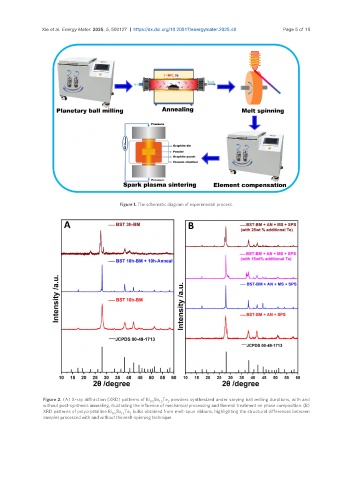
Figure 1. The schematic diagram of experimental process.
Figure 2. (A) X-ray diffraction (XRD) patterns of Bi Sb Te powders synthesized under varying ball milling durations, with and
1.5
3
0.5
without post-synthesis annealing, illustrating the influence of mechanical processing and thermal treatment on phase composition. (B)
XRD patterns of polycrystalline Bi Sb Te bulks obtained from melt-spun ribbons, highlighting the structural differences between
3
0.5
1.5
samples processed with and without the melt-spinning technique.