
Page 118 - Read Online
P. 118
Page 8 of 13 Ashani et al. Energy Mater. 2025, 5, 500111 https://dx.doi.org/10.20517/energymater.2025.10
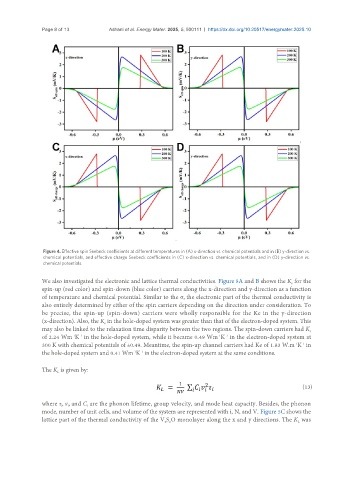
Figure 4. Effective spin Seebeck coefficients at different temperatures in (A) x-direction vs. chemical potentials and in (B) y-direction vs.
chemical potentials, and effective charge Seebeck coefficients in (C) x-direction vs. chemical potentials, and in (D) y-direction vs.
chemical potentials.
We also investigated the electronic and lattice thermal conductivities. Figure 5A and B shows the K for the
e
spin-up (red color) and spin-down (blue color) carriers along the x-direction and y-direction as a function
of temperature and chemical potential. Similar to the σ, the electronic part of the thermal conductivity is
also entirely determined by either of the spin carriers depending on the direction under consideration. To
be precise, the spin-up (spin-down) carriers were wholly responsible for the Ke in the y-direction
(x-direction). Also, the K in the hole-doped system was greater than that of the electron-doped system. This
e
may also be linked to the relaxation time disparity between the two regions. The spin-down carriers had K e
of 2.24 Wm K in the hole-doped system, while it became 0.49 Wm K in the electron-doped system at
-1
-1
-1
-1
-1
-1
300 K with chemical potentials of ±0.49. Meantime, the spin-up channel carriers had Ke of 1.83 W.m K in
the hole-doped system and 0.41 Wm K in the electron-doped system at the same conditions.
-1
-1
The K is given by:
L
(13)
where τ, v, and C are the phonon lifetime, group velocity, and mode heat capacity. Besides, the phonon
i
i
i
mode, number of unit cells, and volume of the system are represented with i, N, and V. Figure 5C shows the
lattice part of the thermal conductivity of the V S O monolayer along the x and y directions. The K was
2 2
L