
Page 44 - Read Online
P. 44
Page 16 of 24 Boaretto et al. Energy Mater. 2025, 5, 500040 https://dx.doi.org/10.20517/energymater.2024.203
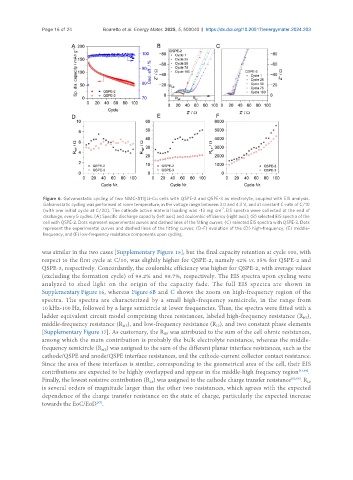
Figure 6. Galvanostatic cycling of two NMC-811||Li-Cu cells with QSPE-2 and QSPE-3 as electrolyte, coupled with EIS analysis.
Galvanostatic cycling was performed at room temperature, in the voltage range between 3.0 and 4.3 V, and at constant C-rate of C/10
-2
(with one initial cycle at C/20). The cathode active material loading was ~13 mg cm . EIS spectra were collected at the end of
discharge, every 5 cycles. (A) Specific discharge capacity (left axis) and coulombic efficiency (right axis); (B) selected EIS spectra of the
cell with QSPE-2. Dots represent experimental curves and dashed lines of the fitting curves; (C) selected EIS spectra with QSPE-3. Dots
represent the experimental curves and dashed lines of the fitting curves; (D-F) evolution of the (D) high-frequency, (E) middle-
frequency, and (F) low-frequency resistance components upon cycling.
was similar in the two cases [Supplementary Figure 15], but the final capacity retention at cycle 100, with
respect to the first cycle at C/10, was slightly higher for QSPE-2, namely 42% vs. 35% for QSPE-2 and
QSPE-3, respectively. Concordantly, the coulombic efficiency was higher for QSPE-2, with average values
(excluding the formation cycle) of 99.2% and 98.7%, respectively. The EIS spectra upon cycling were
analyzed to shed light on the origin of the capacity fade. The full EIS spectra are shown in
Supplementary Figure 16, whereas Figure 6B and C shows the zoom on high-frequency region of the
spectra. The spectra are characterized by a small high-frequency semicircle, in the range from
10 kHz-100 Hz, followed by a large semicircle at lower frequencies. Thus, the spectra were fitted with a
ladder equivalent circuit model comprising three resistances, labeled high-frequency resistance (R ),
HF
middle-frequency resistance (R ), and low-frequency resistance (R ), and two constant phase elements
LF
MF
[Supplementary Figure 17]. As customary, the R was attributed to the sum of the cell ohmic resistances,
HF
among which the main contribution is probably the bulk electrolyte resistance, whereas the middle-
frequency semicircle (R ) was assigned to the sum of the different planar interface resistances, such as the
MF
cathode/QSPE and anode/QSPE interface resistances, and the cathode-current collector contact resistance.
Since the area of these interfaces is similar, corresponding to the geometrical area of the cell, their EIS
contributions are expected to be highly overlapped and appear in the middle-high frequency region [63,64] .
Finally, the lowest resistive contribution (R ) was assigned to the cathode charge transfer resistance [65,66] . R
LF
LF
is several orders of magnitude larger than the other two resistances, which agrees with the expected
dependence of the charge transfer resistance on the state of charge, particularly the expected increase
towards the EoC/EoD .
[67]