
Page 42 - Read Online
P. 42
Page 14 of 24 Boaretto et al. Energy Mater. 2025, 5, 500040 https://dx.doi.org/10.20517/energymater.2024.203
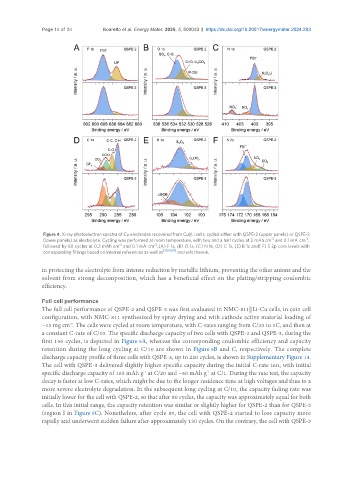
Figure 4. X-ray photoelectron spectra of Cu electrodes recovered from Cu||Li cells, cycled either with QSPE-2 (upper panels) or QSPE-3
-2
-2
(lower panels) as electrolyte. Cycling was performed at room temperature, with two and a half cycles at 2 mAh cm and 0.1 mA cm ,
-2
-2
followed by 50 cycles at 0.2 mAh cm and 0.1 mA cm . (A) F 1s, (B) O 1s, (C) N 1s, (D) C 1s, (E) B 1s and( F) S 2p core levels with
corresponding fittings based on internal references as well as [38,60,61] and refs therein.
in protecting the electrolyte from intense reduction by metallic lithium, preventing the other anions and the
solvent from strong decomposition, which has a beneficial effect on the plating/stripping coulombic
efficiency.
Full cell performance
The full cell performance of QSPE-2 and QSPE-3 was first evaluated in NMC-811||Li-Cu cells, in coin cell
configuration, with NMC-811 synthesized by spray drying and with cathode active material loading of
~13 mg cm . The cells were cycled at room temperature, with C-rates ranging from C/20 to 1C, and then at
-2
a constant C-rate of C/10. The specific discharge capacity of two cells with QSPE-2 and QSPE-3, during the
first 150 cycles, is depicted in Figure 5A, whereas the corresponding coulombic efficiency and capacity
retention during the long cycling at C/10 are shown in Figure 5B and C, respectively. The complete
discharge capacity profile of three cells with QSPE-3, up to 220 cycles, is shown in Supplementary Figure 14.
The cell with QSPE-3 delivered slightly higher specific capacity during the initial C-rate test, with initial
specific discharge capacity of 165 mAh g at C/20 and ~60 mAh g at C/1. During the rate test, the capacity
-1
-1
decay is faster at low C-rates, which might be due to the longer residence time at high voltages and thus to a
more severe electrolyte degradation. In the subsequent long cycling at C/10, the capacity fading rate was
initially lower for the cell with QSPE-2, so that after 80 cycles, the capacity was approximately equal for both
cells. In this initial range, the capacity retention was similar or slightly higher for QSPE-2 than for QSPE-3
(region I in Figure 5C). Nonetheless, after cycle 80, the cell with QSPE-2 started to lose capacity more
rapidly and underwent sudden failure after approximately 130 cycles. On the contrary, the cell with QSPE-3