
Page 35 - Read Online
P. 35
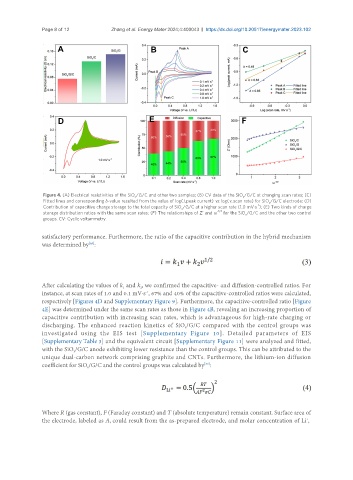
Page 8 of 12            Zhang et al. Energy Mater 2024;4:400043  https://dx.doi.org/10.20517/energymater.2023.102


                Figure 4. (A) Electrical resistivities of the SiO /G/C and other two samples; (B) CV data of the SiO /G/C at changing scan rates; (C)
                                              x
                                                                                   x
                Fitted lines and corresponding b-value resulted from the value of log(i, peak current)  vs. log(v, scan rate) for SiO /G/C electrode; (D)
                                                                                            x
                                                                                        -1
                Contribution of capacitive charge storage to the total capacity of SiO /G/C at a higher scan rate (1.0 mV·s ); (E) Two kinds of charge
                                                              x
                storage distribution ratios with the same scan rates; (F) The relationships of Z’ and ω -1/2  for the SiO /G/C and the other two control
                                                                                    x
                groups. CV: Cyclic voltammetry.
               satisfactory performance. Furthermore, the ratio of the capacitive contribution in the hybrid mechanism
               was determined by :
                               [45]


               After calculating the values of k  and k , we confirmed the capacitive- and diffusion-controlled ratios. For
                                                2
                                          1
               instance, at scan rates of 1.0 and 0.1 mV·s , 67% and 40% of the capacitive-controlled ratios were calculated,
                                                  -1
               respectively [Figures 4D and Supplementary Figure 9]. Furthermore, the capacitive-controlled ratio [Figure
               4E] was determined under the same scan rates as those in Figure 4B, revealing an increasing proportion of
               capacitive contribution with increasing scan rates, which is advantageous for high-rate charging or
               discharging. The enhanced reaction kinetics of SiO /G/C compared with the control groups was
                                                               x
               investigated  using  the  EIS  test  [Supplementary  Figure  10].  Detailed  parameters  of  EIS
               [Supplementary Table 3] and the equivalent circuit [Supplementary Figure 11] were analyzed and fitted,
               with the SiO /G/C anode exhibiting lower resistance than the control groups. This can be attributed to the
                          x
               unique dual-carbon network comprising graphite and CNTs. Furthermore, the lithium-ion diffusion
                                                                      [33]
               coefficient for SiO /G/C and the control groups was calculated by :
                              x


               Where R (gas constant), F (Faraday constant) and T (absolute temperature) remain constant. Surface area of
               the electrode, labeled as A, could result from the as-prepared electrode, and molar concentration of Li ,
                                                                                                        +