
Page 34 - Read Online
P. 34
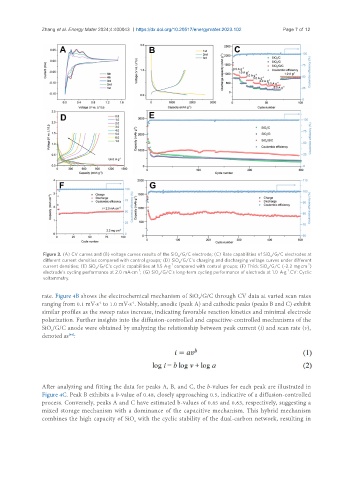
Zhang et al. Energy Mater 2024;4:400043  https://dx.doi.org/10.20517/energymater.2023.102  Page 7 of 12


                Figure 3. (A) CV curves and (B) voltage curves results of the SiO /G/C electrode; (C) Rate capabilities of SiO /G/C electrodes at
                                                             x
                                                                                            x
                different current densities compared with control groups; (D) SiO /G/C’s charging and discharging voltage curves under different
                                                             x
                                                           -1
                                                                                                         -2
                current densities; (E) SiO /G/C’s cyclic capabilities at 1.5 A·g  compared with control groups; (F) Thick SiO /G/C (~2.2 mg·cm )
                                 x
                                                                                           x
                                                                                                  -1
                                               -2
                electrode’s cycling performance at 2.0 mA·cm ; (G) SiO /G/C’s long-term cycling performance of electrode at 1.0  A·g . CV: Cyclic
                                                      x
                voltammetry.
               rate. Figure 4B shows the electrochemical mechanism of SiO /G/C through CV data at varied scan rates
                                                                    x
                                  -1
                                             -1
               ranging from 0.1 mV·s  to 1.0 mV·s . Notably, anodic (peak A) and cathodic peaks (peaks B and C) exhibit
               similar profiles as the sweep rates increase, indicating favorable reaction kinetics and minimal electrode
               polarization. Further insights into the diffusion-controlled and capacitive-controlled mechanisms of the
               SiO /G/C anode were obtained by analyzing the relationship between peak current (i) and scan rate (v),
                  x
               denoted as :
                        [44]
               After analyzing and fitting the data for peaks A, B, and C, the b-values for each peak are illustrated in
               Figure 4C. Peak B exhibits a b-value of 0.48, closely approaching 0.5, indicative of a diffusion-controlled
               process. Conversely, peaks A and C have estimated b-values of 0.85 and 0.63, respectively, suggesting a
               mixed storage mechanism with a dominance of the capacitive mechanism. This hybrid mechanism
               combines the high capacity of SiO  with the cyclic stability of the dual-carbon network, resulting in
                                              x