Page 32 - Read Online
P. 32

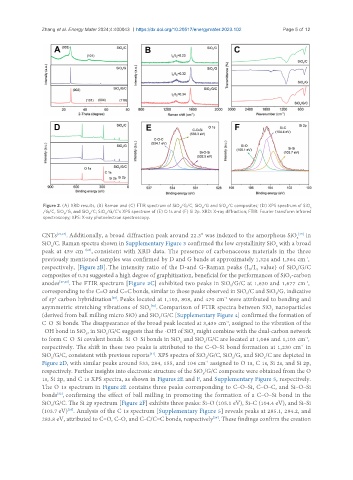
Zhang et al. Energy Mater 2024;4:400043  https://dx.doi.org/10.20517/energymater.2023.102  Page 5 of 12


                Figure 2. (A) XRD results, (B) Raman and (C) FTIR spectrum of SiO /G/C, SiO /G and SiO /C composites; (D) XPS spectrum of SiO x
                                                              x
                                                                             x
                                                                     x
                /G/C, SiO /G, and SiO /C; SiO /G/C’s XPS spectrum of (E) O 1s and (F) Si 2p. XRD: X-ray diffraction; FTIR: Fourier transform infrared
                       x
                                    x
                               x
                spectroscopy; XPS: X-ray photoelectron spectroscopy.
                                                                                                      [25]
               CNTs [23,24] . Additionally, a broad diffraction peak around 22.3° was indexed to the amorphous SiO  in
                                                                                                     x
               SiO /C. Raman spectra shown in Supplementary Figure 3 confirmed the low crystallinity SiO  with a broad
                  x
                                                                                              x
               peak at 459 cm -1[26] , consistent with XRD data. The presence of carbonaceous materials in the three
                                                                                                        -1
               previously mentioned samples was confirmed by D and G bands at approximately 1,324 and 1,564 cm ,
               respectively, [Figure 2B]. The intensity ratio of the D-and G-Raman peaks (I /I  value) of SiO /G/C
                                                                                     D
                                                                                                     x
                                                                                       G
               composites of 0.34 suggested a high degree of graphitization, beneficial for the performances of SiO -carbon
                                                                                                   x
               anodes [27,28] . The FTIR spectrum [Figure 2C] exhibited two peaks in SiO /G/C at 1,630 and 1,677 cm ,
                                                                                                        -1
                                                                               x
               corresponding to the C=O and C=C bonds, similar to those peaks observed in SiO /C and SiO /G, indicative
                                                                                    x
                                                                                              x
               of sp  carbon hybridization . Peaks located at 1,103, 808, and 470 cm  were attributed to bending and
                                       [29]
                                                                             -1
                   2
               asymmetric stretching vibrations of SiO . Comparison of FTIR spectra between SiO  nanoparticles
                                                    [30]
                                                                                             x
                                                   x
               (derived from ball milling micro SiO) and SiO /G/C [Supplementary Figure 4] confirmed the formation of
                                                       x
               C–O–Si bonds. The disappearance of the broad peak located at 3,435 cm , assigned to the vibration of the
                                                                             -1
               –OH bond in SiO , in SiO /G/C suggests that the -OH of SiO  might combine with the dual-carbon network
                                                                  x
                              x
                                     x
               to form C–O–Si covalent bonds. Si–O–Si bonds in SiO  and SiO /G/C are located at 1,086 and 1,103 cm ,
                                                                                                        -1
                                                                      x
                                                              x
               respectively. The shift in these two peaks is attributed to the C–O–Si bond formation at 1,230 cm  in
                                                                                                      -1
                                                   [31]
               SiO /G/C, consistent with previous reports . XPS spectra of SiO /G/C, SiO /G, and SiO /C are depicted in
                                                                               x
                                                                                          x
                  x
                                                                      x
               Figure 2D, with similar peaks around 533, 284, 155, and 104 cm  assigned to O 1s, C 1s, Si 2s, and Si 2p,
                                                                      -1
               respectively. Further insights into electronic structure of the SiO /G/C composite were obtained from the O
                                                                     x
               1s, Si 2p, and C 1s XPS spectra, as shown in Figures 2E and F, and Supplementary Figure 5, respectively.
               The O 1s spectrum in Figure 2E contains three peaks corresponding to C–O–Si, C–O–C, and Si–O–Si
               bonds , confirming the effect of ball milling in promoting the formation of a C–O–Si bond in the
                    [32]
               SiO /G/C. The Si 2p spectrum [Figure 2F] exhibits three peaks: Si–O (105.1 eV), Si–C (104.4 eV), and Si–Si
                  x
               (103.7 eV) . Analysis of the C 1s spectrum [Supplementary Figure 5] reveals peaks at 285.1, 284.2, and
                        [33]
               283.8 eV, attributed to C=O, C–O, and C–C/C=C bonds, respectively . These findings confirm the creation
                                                                         [34]
   27   28   29   30   31   32   33   34   35   36   37