


Page 30 - 2417
P. 30
Page 6 of 23                                                  Chaib et al. Carbon Footprints 2026, 5, 23


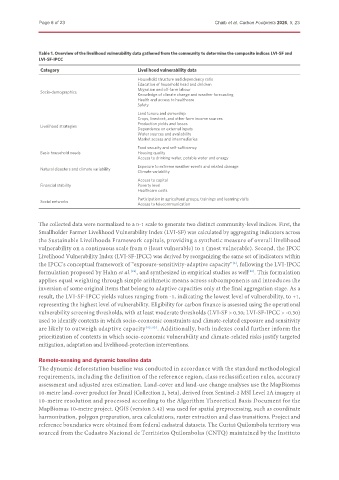
               Table 1. Overview of the livelihood vulnerability data gathered from the community to determine the composite indices LVI-SF and
               LVI-SF-IPCC

               Category                          Livelihood vulnerability data
                                                 Household structure and dependency ratio
                                                 Education of household head and children
                                                 Migration and off-farm labour
               Socio-demographics
                                                 Knowledge of climate change and weather forecasting
                                                 Health and access to healthcare
                                                 Safety
                                                 Land tenure and ownership
                                                 Crops, livestock, and other farm income sources
                                                 Production yields and losses
               Livelihood strategies
                                                 Dependence on external inputs
                                                 Water sources and availability
                                                 Market access and intermediaries
                                                 Food security and self-sufficiency
               Basic household needs             Housing quality
                                                 Access to drinking water, potable water and energy
                                                 Exposure to extreme weather events and related damage
               Natural disasters and climate variability
                                                 Climate variability
                                                 Access to capital
               Financial stability               Poverty level
                                                 Healthcare costs
                                                 Participation in agricultural groups, trainings and learning visits
               Social networks
                                                 Access to telecommunication

               The collected data were normalized to a 0-1 scale to generate two distinct community-level indices. First, the
               Smallholder Farmer Livelihood Vulnerability Index (LVI-SF) was calculated by aggregating indicators across
               the Sustainable Livelihoods Framework capitals, providing a synthetic measure of overall livelihood
               vulnerability on a continuous scale from 0 (least vulnerable) to 1 (most vulnerable). Second, the IPCC
               Livelihood Vulnerability Index (LVI-SF-IPCC) was derived by reorganizing the same set of indicators within
               the IPCC’s conceptual framework of “exposure-sensitivity-adaptive capacity” , following the LVI-IPCC
                                                                                   [5]
               formulation proposed by Hahn et al. , and synthesized in empirical studies as well . This formulation
                                               [45]
                                                                                        [50]
               applies equal weighting through simple arithmetic means across subcomponents and introduces the
               inversion of some original items that belong to adaptive capacities only at the final aggregation stage. As a
               result, the LVI-SF-IPCC yields values ranging from -1, indicating the lowest level of vulnerability, to +1,
               representing the highest level of vulnerability. Eligibility for carbon finance is assessed using the operational
               vulnerability screening thresholds, with at least moderate thresholds (LVI-SF > 0.30; LVI-SF-IPCC > -0.30)
               used to identify contexts in which socio-economic constraints and climate-related exposure and sensitivity
               are likely to outweigh adaptive capacity [42,43] . Additionally, both indexes could further inform the
               prioritization of contexts in which socio-economic vulnerability and climate-related risks justify targeted
               mitigation, adaptation and livelihood-protection interventions.


               Remote-sensing and dynamic baseline data
               The dynamic deforestation baseline was conducted in accordance with the standard methodological
               requirements, including the definition of the reference region, class reclassification rules, accuracy
               assessment and adjusted area estimation. Land-cover and land-use change analyses use the MapBiomas
               10-metre land-cover product for Brazil (Collection 2, beta), derived from Sentinel-2 MSI Level 2A imagery at
               10-metre resolution and processed according to the Algorithm Theoretical Basis Document for the
               MapBiomas 10-metre project. QGIS (version 3.42) was used for spatial preprocessing, such as coordinate
               harmonization, polygon preparation, area calculations, raster extraction and class transitions. Project and
               reference boundaries were obtained from federal cadastral datasets. The Curiaú Quilombola territory was
               sourced from the Cadastro Nacional de Territórios Quilombolas (CNTQ) maintained by the Instituto

