


Page 29 - 2417
P. 29
Chaib et al. Carbon Footprints 2026, 5, 23                                        Page 5 of 23


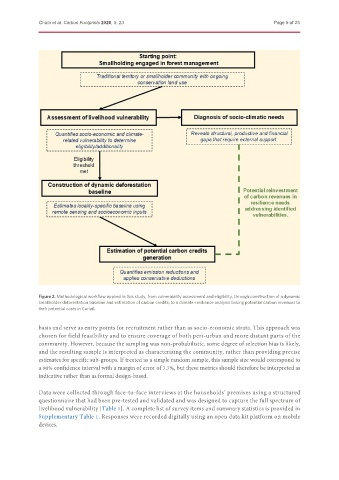
               Figure 2. Methodological workflow applied in this study, from vulnerability assessment and eligibility, through construction of a dynamic
               smallholder deforestation baseline and estimation of carbon credits, to a climate-resilience analysis linking potential carbon revenues to
               their potential costs in Curiaú.


               basis and serve as entry points for recruitment rather than as socio-economic strata. This approach was
               chosen for field feasibility and to ensure coverage of both peri-urban and more distant parts of the
               community. However, because the sampling was non-probabilistic, some degree of selection bias is likely,
               and the resulting sample is interpreted as characterizing the community, rather than providing precise
               estimates for specific sub-groups. If treated as a simple random sample, this sample size would correspond to
               a 90% confidence interval with a margin of error of 7.7%, but these metrics should therefore be interpreted as
               indicative rather than as formal design-based.


               Data were collected through face-to-face interviews at the households’ premises using a structured
               questionnaire that had been pre-tested and validated and was designed to capture the full spectrum of
               livelihood vulnerability [Table 1]. A complete list of survey items and summary statistics is provided in
               Supplementary Table 1. Responses were recorded digitally using an open data kit platform on mobile
               devices.

