


Page 12 - 2417
P. 12
Page 8 of 20                                                 Corsini et al. Carbon Footprints 2026, 5, 34


               associated with smaller size or irregular geometry, are more exposed to external influences and therefore,
               exhibit a smoother decay curve (lower β). Conversely, larger or more compact habitats show steeper
               attenuation of pressure (higher β). In these formulations, β acts as a modulator of the response, reflecting the
               degree of ecological resilience or susceptibility of the landscape to external stress.


               Operationally, beta is obtained from two independent components:


               (i) a shape-based circularity index (CI), representing geometric exposure to edge effects; and

               (ii) an area-based resistance factor (k), representing the buffering effect of fragment size.


               • Circularity index (CI)
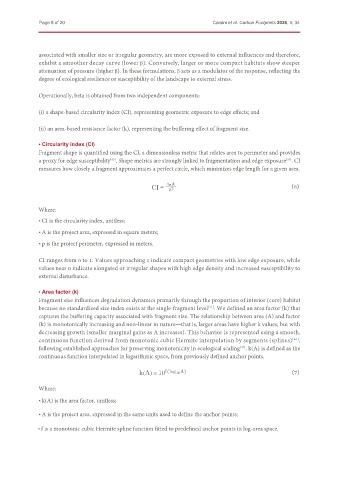
               Fragment shape is quantified using the CI, a dimensionless metric that relates area to perimeter and provides
               a proxy for edge susceptibility . Shape metrics are strongly linked to fragmentation and edge exposure . CI
                                        [45]
                                                                                                     [33]
               measures how closely a fragment approximates a perfect circle, which minimizes edge length for a given area.

                                                           4  A                                        (6)
                                                      CI  =  p 2


               Where:
               • CI is the circularity index, unitless;

               • A is the project area, expressed in square meters;
               • p is the project perimeter, expressed in meters.


               CI ranges from 0 to 1. Values approaching 1 indicate compact geometries with low edge exposure, while
               values near 0 indicate elongated or irregular shapes with high edge density and increased susceptibility to
               external disturbance.

               • Area factor (k)
               Fragment size influences degradation dynamics primarily through the proportion of interior (core) habitat
               because no standardized size index exists at the single-fragment level . We defined an area factor (k) that
                                                                          [41]
               captures the buffering capacity associated with fragment size. The relationship between area (A) and factor
               (k) is monotonically increasing and non-linear in nature—that is, larger areas have higher k values, but with
               decreasing growth (smaller marginal gains as A increases). This behavior is represented using a smooth,
               continuous function derived from monotonic cubic Hermite interpolation by segments (splines) ,
                                                                                                        [46]
               following established approaches for preserving monotonicity in ecological scaling . k(A) is defined as the
                                                                                     [47]
               continuous function interpolated in logarithmic space, from previously defined anchor points.

                                                  k(A) = 10 f(log 10 A)                                 (7)

               Where:

               • k(A) is the area factor, unitless;

               • A is the project area, expressed in the same units used to define the anchor points;

              • f is a monotonic cubic Hermite spline function fitted to predefined anchor points in log-area space.

