


Page 8 - 2417
P. 8
Page 4 of 20                                                 Corsini et al. Carbon Footprints 2026, 5, 34


               Where:


               • R(d) is the buffer radius, defining the internal limit of degradation risk, expressed in meters;


               • α is the maximum distance of anthropogenic matrix influence within the project area, expressed in meters;

               • β is the exponential decay rate, governing how rapidly the influence attenuates with distance, expressed in
               m .
                -1
               • d is the distance between each point on the edge of the project area and the nearest deforested area within
               the landscape, expressed in meters;


               • e  is the exponential term, unitless.
                 -βd


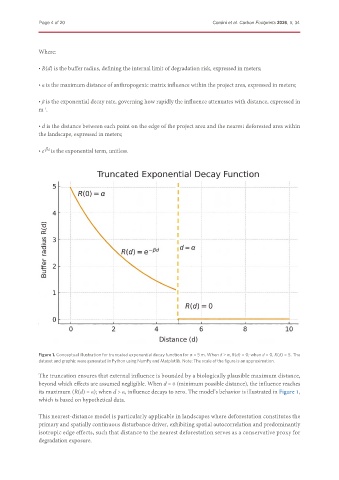
               Figure 1. Conceptual illustration for truncated exponential decay function for α = 5 m. When d > α, R(d) = 0; when d = 0, R(d) = 5. The
               dataset and graphic were generated in Python using NumPy and Matplotlib. Note: The scale of the figure is an approximation.

               The truncation ensures that external influence is bounded by a biologically plausible maximum distance,
               beyond which effects are assumed negligible. When d = 0 (minimum possible distance), the influence reaches
               its maximum (R(d) = α); when d > α, influence decays to zero. The model’s behavior is illustrated in Figure 1,
               which is based on hypothetical data.


               This nearest-distance model is particularly applicable in landscapes where deforestation constitutes the
               primary and spatially continuous disturbance driver, exhibiting spatial autocorrelation and predominantly
               isotropic edge effects, such that distance to the nearest deforestation serves as a conservative proxy for
               degradation exposure.

