


Page 10 - 2417
P. 10
Page 6 of 20                                                 Corsini et al. Carbon Footprints 2026, 5, 34


               The MapBiomas dataset was subsequently reclassified into a binary deforestation matrix, in which
               anthropogenic land uses are assigned a value of 1 (deforested), while all remaining land-cover classes are
               assigned a value of 0 (non-deforested). The resulting matrix serves as the fundamental layer from which we
               calculate the Euclidean distance (d) to the nearest deforested pixel, generating a continuous "distance to
               deforestation" surface. This distance raster is then used in the remaining steps.


               • Euclidean distance
               After generating the binary deforestation matrix, the next preparatory step consists of computing Euclidean
               distance surface to quantify how far each location within the study area lies from the nearest deforested pixel.
               The Euclidean distance algorithm measures the shortest straight-line distance between every non-deforested
               cell (value 0) and the nearest cell classified as deforested (value 1), producing a continuous raster in which
               each pixel contains a distance value expressed in map units. This approach follows the standard convention
               in landscape ecology, where proximity to edges and disturbance sources is represented as straight-line
               distance due to its geometric clarity and established empirical performance [27,33,37] . Because edge influence and
               degradation processes tend to diffuse outward from deforestation boundaries in approximately radial
               patterns, distance, from Euclidean distance algorithm, has long been recognized as the most appropriate
               metric for capturing spatial exposure to anthropogenic pressure [19,30,38] . The resulting distance raster captures
               the spatial gradient of deforestation intensity and, in addition to being used to determine alpha, serves as the
               main input variable (d) for the exponential degradation model.

               • Weighted landscape class proportion (PL w )
               The Weighted Landscape Class Proportion (PL ) is an original metric proposed in this study, designed to
                                                        w
               quantify deforestation pressure, in terms of magnitude and proximity, by integrating class proportion with a
               distance-based weighting function. It is constructed to translate the quantity and spatial configuration of
               deforestation within the RR into an effective measure of external anthropogenic pressure.


               The calculation of the PL  is performed based on the following steps:
                                    w

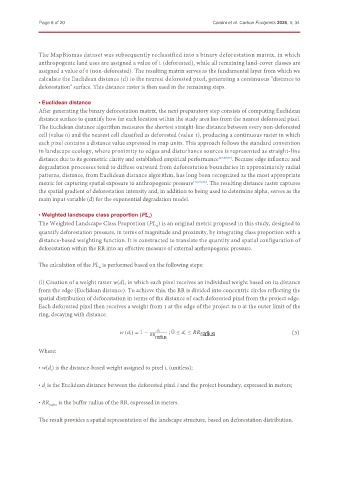
               (i) Creation of a weight raster w(d), in which each pixel receives an individual weight based on its distance
               from the edge (Euclidean distance). To achieve this, the RR is divided into concentric circles reflecting the
               spatial distribution of deforestation in terms of the distance of each deforested pixel from the project edge.
               Each deforested pixel then receives a weight from 1 at the edge of the project to 0 at the outer limit of the
               ring, decaying with distance.


                                              (      ) = 1 −  ;0 ≤       ≤      radius                  (3)

                                                        radius
               Where:


               • w(d) is the distance-based weight assigned to pixel i, (unitless);
                   i
               • d is the Euclidean distance between the deforested pixel i and the project boundary, expressed in meters;
                 i

               • RR radius  is the buffer radius of the RR, expressed in meters.


               The result provides a spatial representation of the landscape structure, based on deforestation distribution.

