


Page 15 - 2417
P. 15
Corsini et al. Carbon Footprints 2026, 5, 34                                     Page 11 of 20


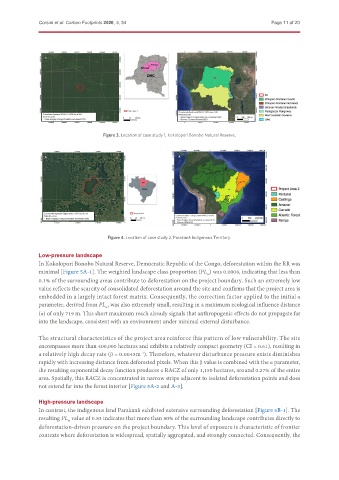
                                     Figure 3. Location of case study 1, Kokolopori Bonobo Natural Reserve.


                                       Figure 4. Location of case study 2, Parakanã Indigenous Territory.

               Low-pressure landscape
               In Kokolopori Bonobo Natural Reserve, Democratic Republic of the Congo, deforestation within the RR was
               minimal [Figure 5A-1]. The weighted landscape class proportion (PL ) was 0.0008, indicating that less than
                                                                          w
               0.1% of the surrounding areas contribute to deforestation on the project boundary. Such an extremely low
               value reflects the scarcity of consolidated deforestation around the site and confirms that the project area is
               embedded in a largely intact forest matrix. Consequently, the correction factor applied to the initial α
               parameter, derived from PL , was also extremely small, resulting in a maximum ecological influence distance
                                      w
               (α) of only 719 m. This short maximum reach already signals that anthropogenic effects do not propagate far
               into the landscape, consistent with an environment under minimal external disturbance.


               The structural characteristics of the project area reinforce this pattern of low vulnerability. The site
               encompasses more than 400,000 hectares and exhibits a relatively compact geometry (CI = 0.61), resulting in
               a relatively high decay rate (β = 0.0043m ). Therefore, whatever disturbance pressure exists diminishes
                                                  -1
               rapidly with increasing distance from deforested pixels. When this β value is combined with the α parameter,
               the resulting exponential decay function produces a RACZ of only 1,150 hectares, around 0.27% of the entire
               area. Spatially, this RACZ is concentrated in narrow strips adjacent to isolated deforestation points and does
               not extend far into the forest interior [Figure 5A-2 and A-3].

               High-pressure landscape
               In contrast, the indigenous land Parakanã exhibited extensive surrounding deforestation [Figure 5B-1]. The
               resulting PL  value of 0.83 indicates that more than 80% of the surrounding landscape contributes directly to
                         w
               deforestation-driven pressure on the project boundary. This level of exposure is characteristic of frontier
               contexts where deforestation is widespread, spatially aggregated, and strongly connected. Consequently, the

