


Page 16 - 2417
P. 16
Page 12 of 20                                                Corsini et al. Carbon Footprints 2026, 5, 34


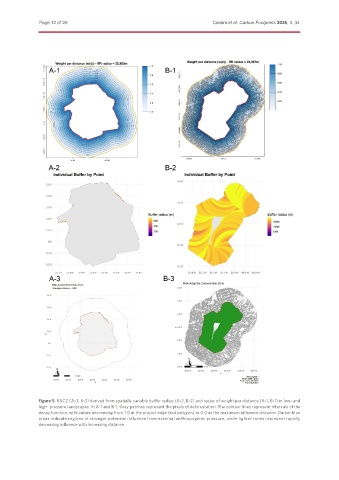
               Figure 5. RACZ (A-3, B-3) derived from spatially variable buffer radius (A-2, B-2) and raster of weight per distance (A-1, B-1) in low- and
               high- pressure landscapes. In A-1 and B-1, Grey patches represent the pixels of deforestation. The contour lines represent intervals of the
               decay function, with values decreasing from 1.0 at the project edge (red polygon) to 0.0 at the maximum influence distance. Darker blue
               areas indicate regions of stronger potential influence from external anthropogenic pressure, while lighter tones represent rapidly
               decreasing influence with increasing distance.

