


Page 11 - 2417
P. 11
Corsini et al. Carbon Footprints 2026, 5, 34                                      Page 7 of 20


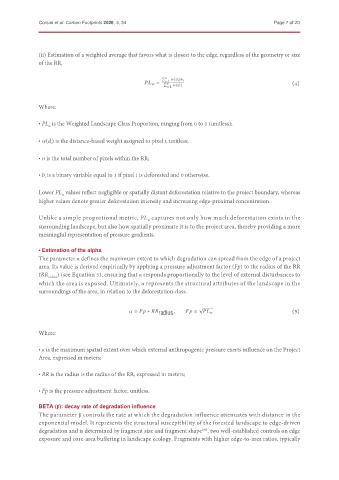
               (ii) Estimation of a weighted average that favors what is closest to the edge, regardless of the geometry or size
               of the RR.


                                                          Í
                                                            =  Í   =1    (      )                       (4)

                                                              =1    (      )
               Where:


               • PL  is the Weighted Landscape Class Proportion, ranging from 0 to 1 (unitless);
                  w

               • w(d) is the distance-based weight assigned to pixel i, unitless;
                   i

               • n is the total number of pixels within the RR;

               • b is a binary variable equal to 1 if pixel i is deforested and 0 otherwise.
                 i

               Lower PL  values reflect negligible or spatially distant deforestation relative to the project boundary, whereas
                       w
               higher values denote greater deforestation intensity and increasing edge-proximal concentration.


               Unlike a simple proportional metric, PL  captures not only how much deforestation exists in the
                                                     w
               surrounding landscape, but also how spatially proximate it is to the project area, thereby providing a more
               meaningful representation of pressure gradients.


               • Estimation of the alpha
               The parameter α defines the maximum extent to which degradation can spread from the edge of a project
               area. Its value is derived empirically by applying a pressure adjustment factor (Fp) to the radius of the RR
               (RR radius ) (see Equation 5), ensuring that α responds proportionally to the level of external disturbances to
               which the area is exposed. Ultimately, α represents the structural attributes of the landscape in the
               surroundings of the area, in relation to the deforestation class.


                                                                       √
                                                 =      ∗      radius  ,       =                        (5)


               Where:


               • α is the maximum spatial extent over which external anthropogenic pressure exerts influence on the Project
               Area, expressed in meters;


               • RR is the radius is the radius of the RR, expressed in meters;


               • Fp is the pressure adjustment factor, unitless.

               BETA (β): decay rate of degradation influence
               The parameter β controls the rate at which the degradation influence attenuates with distance in the
               exponential model. It represents the structural susceptibility of the forested landscape to edge-driven
               degradation and is determined by fragment size and fragment shape , two well-established controls on edge
                                                                        [40]
               exposure and core-area buffering in landscape ecology. Fragments with higher edge-to-area ratios, typically

