


Page 54 - Read online
P. 54
Page 10 of 23                                            Diaz-Vallejo et al. Carbon Footprints 2026, 5, 12


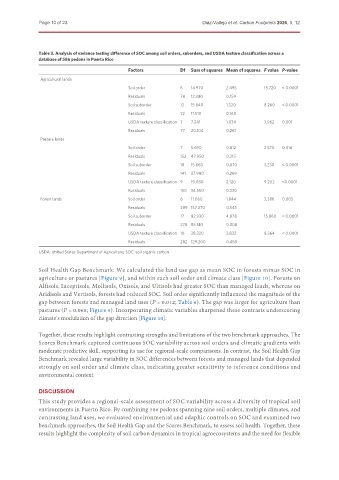
               Table 3. Analysis of variance testing difference of SOC among soil orders, suborders, and USDA texture classification across a
               database of 586 pedons in Puerto Rico

                                              Factors           Df  Sum of squares Mean of squares F value P-value
               Agricultural lands
                                              Soil order        6   14.970      2.495         15.720  < 0.0001
                                              Residuals         78  12.380      0.159
                                              Soil suborder     12  15.840      1.320         8.260  < 0.0001
                                              Residuals         72  11.510      0.160
                                              USDA texture classification 7  7.241  1.034     3.962  0.001
                                              Residuals         77  20.104      0.261
               Pasture lands
                                              Soil order        7   5.690       0.812         2.575  0.016
                                              Residuals         152  47.950     0.315
                                              Soil suborder     18  15.660      0.870         3.230  < 0.0001
                                              Residuals         141  37.980     0.269
                                              USDA texture classification 9  19.080  2.120    9.202  <0.0001
                                              Residuals         150 34.550      0.230
               Forest lands                   Soil order        6   11.060      1.844         3.386  0.003
                                              Residuals         289 157.370     0.545
                                              Soil suborder     17  82.930      4.878         15.860  < 0.0001
                                              Residuals         278 85.510      0.308
                                              USDA texture classification 10  38.320  3.832   8.364  < 0.0001
                                              Residuals         282 129.200     0.458

               USDA: United States Department of Agriculture; SOC: soil organic carbon.

               Soil Health Gap Benchmark: We calculated the land use gap as mean SOC in forests minus SOC in
               agriculture or pastures [Figure 9], and within each soil order and climate class [Figure 10]. Forests on
               Alfisols, Inceptisols, Mollisols, Oxisols, and Ultisols had greater SOC than managed lands, whereas on
               Aridisols and Vertisols, forests had reduced SOC. Soil order significantly influenced the magnitude of the
               gap between forests and managed land uses (P = 0.012; Table 6). The gap was larger for agriculture than
               pastures (P = 0.068; Figure 9). Incorporating climatic variables sharpened these contrasts underscoring
               climate’s modulation of the gap direction [Figure 10].

               Together, these results highlight contrasting strengths and limitations of the two benchmark approaches. The
               Scores Benchmark captured continuous SOC variability across soil orders and climatic gradients with
               moderate predictive skill, supporting its use for regional-scale comparisons. In contrast, the Soil Health Gap
               Benchmark revealed large variability in SOC differences between forests and managed lands that depended
               strongly on soil order and climate class, indicating greater sensitivity to reference conditions and
               environmental context.


               DISCUSSION
               This study provides a regional-scale assessment of SOC variability across a diversity of tropical soil
               environments in Puerto Rico. By combining 586 pedons spanning nine soil orders, multiple climates, and
               contrasting land uses, we evaluated environmental and edaphic controls on SOC and examined two
               benchmark approaches, the Soil Health Gap and the Scores Benchmark, to assess soil health. Together, these
               results highlight the complexity of soil carbon dynamics in tropical agroecosystems and the need for flexible

