


Page 52 - Read online
P. 52
Page 8 of 23                                             Diaz-Vallejo et al. Carbon Footprints 2026, 5, 12


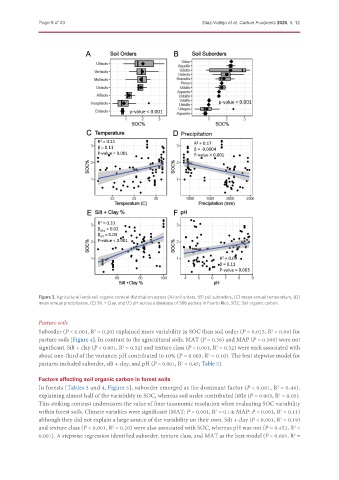
               Figure 3. Agricultural lands soil organic content distribution across (A) soil orders, (B) soil suborders, (C) mean annual temperature, (D)
               mean annual precipitation, (E) Silt + Clay, and (F) pH across a database of 586 pedons in Puerto Rico. SOC: Soil organic carbon.


               Pasture soils
               Suborder (P < 0.001, R  = 0.20) explained more variability in SOC than soil order (P = 0.015, R  = 0.06) for
                                  2
                                                                                                2
               pasture soils [Figure 4]. In contrast to the agricultural soils, MAT (P = 0.36) and MAP (P = 0.509) were not
               significant. Silt + clay (P < 0.001, R  = 0.32) and texture class (P < 0.001, R  = 0.32) were each associated with
                                            2
                                                                             2
               about one-third of the variance; pH contributed to 10% (P = 0.003, R  = 0.10). The best stepwise model for
                                                                          2
               pastures included suborder, silt + clay, and pH (P < 0.001, R  = 0.45; Table 5).
                                                                 2
               Factors affecting soil organic carbon in forest soils
               In forests [Tables 3 and 4, Figure 5], suborder emerged as the dominant factor (P < 0.001, R  = 0.46),
                                                                                                   2
               explaining almost half of the variability in SOC, whereas soil order contributed little (P = 0.003, R  = 0.05).
                                                                                                   2
               This striking contrast underscores the value of finer taxonomic resolution when evaluating SOC variability
               within forest soils. Climate variables were significant (MAT: P = 0.001, R  = 0.14; MAP: P < 0.001, R  = 0.11)
                                                                             2
                                                                                                    2
               although they did not explain a large source of the variability on their own. Silt + clay (P < 0.001, R  = 0.19)
                                                                                                   2
               and texture class (P < 0.001, R  = 0.20) were also associated with SOC, whereas pH was not (P = 0.452, R  <
                                                                                                        2
                                        2
               0.001). A stepwise regression identified suborder, texture class, and MAT as the best model (P < 0.001, R  =
                                                                                                        2

