


Page 53 - Read online
P. 53
Diaz-Vallejo et al. Carbon Footprints 2026, 5, 12                                 Page 9 of 23


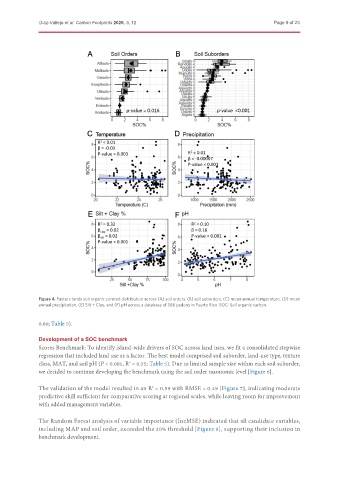
               Figure 4. Pasture lands soil organic content distribution across (A) soil orders, (B) soil suborders, (C) mean annual temperature, (D) mean
               annual precipitation, (E) Silt + Clay, and (F) pH across a database of 586 pedons in Puerto Rico. SOC: Soil organic carbon.


               0.60; Table 5).


               Development of a SOC benchmark
               Scores Benchmark: To identify island-wide drivers of SOC across land uses, we fit a consolidated stepwise
               regression that included land use as a factor. The best model comprised soil suborder, land-use type, texture
               class, MAT, and soil pH (P < 0.001, R  = 0.55; Table 5). Due to limited sample size within each soil suborder,
                                              2
               we decided to continue developing the benchmark using the soil order taxonomic level [Figure 6].

               The validation of the model resulted in an R  = 0.59 with RMSE = 0.49 [Figure 7], indicating moderate
                                                      2
               predictive skill sufficient for comparative scoring at regional scales, while leaving room for improvement
               with added management variables.

               The Random Forest analysis of variable importance (IncMSE) indicated that all candidate variables,
               including MAP and soil order, exceeded the 20% threshold [Figure 8], supporting their inclusion in
               benchmark development.

