


Page 57 - Read online
P. 57
Diaz-Vallejo et al. Carbon Footprints 2026, 5, 12                                Page 13 of 23


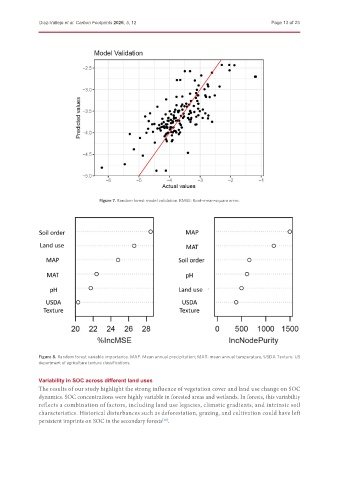
                                    Figure 7. Random forest model validation. RMSE: Root-mean-square error.


               Figure 8. Random forest variable importance. MAP: Mean annual precipitation; MAT: mean annual temperature, USDA Texture: US
               department of agriculture texture classifications.


               Variability in SOC across different land uses
               The results of our study highlight the strong influence of vegetation cover and land use change on SOC
               dynamics. SOC concentrations were highly variable in forested areas and wetlands. In forests, this variability
               reflects a combination of factors, including land use legacies, climatic gradients, and intrinsic soil
               characteristics. Historical disturbances such as deforestation, grazing, and cultivation could have left
               persistent imprints on SOC in the secondary forests .
                                                          [18]

