


Page 50 - Read online
P. 50
Page 6 of 23                                             Diaz-Vallejo et al. Carbon Footprints 2026, 5, 12


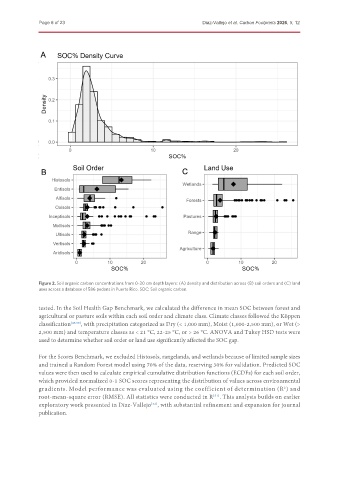
               Figure 2. Soil organic carbon concentrations from 0-30 cm depth layers: (A) density and distribution across (B) soil orders and (C) land
               uses across a database of 586 pedons in Puerto Rico. SOC: Soil organic carbon.

               tested. In the Soil Health Gap Benchmark, we calculated the difference in mean SOC between forest and
               agricultural or pasture soils within each soil order and climate class. Climate classes followed the Köppen
               classification [49,50] , with precipitation categorized as Dry (< 1,000 mm), Moist (1,000-2,500 mm), or Wet (>
               2,500 mm) and temperature classes as < 21 °C, 22-25 °C, or > 26 °C. ANOVA and Tukey HSD tests were
               used to determine whether soil order or land use significantly affected the SOC gap.

               For the Scores Benchmark, we excluded Histosols, rangelands, and wetlands because of limited sample sizes
               and trained a Random Forest model using 70% of the data, reserving 30% for validation. Predicted SOC
               values were then used to calculate empirical cumulative distribution functions (ECDFs) for each soil order,
               which provided normalized 0-1 SOC scores representing the distribution of values across environmental
               gradients. Model performance was evaluated using the coefficient of determination (R ) and
                                                                                                     2
               root-mean-square error (RMSE). All statistics were conducted in R . This analysis builds on earlier
                                                                            [51]
               exploratory work presented in Díaz-Vallejo , with substantial refinement and expansion for journal
                                                      [52]
               publication.

