


Page 51 - Read online
P. 51
Diaz-Vallejo et al. Carbon Footprints 2026, 5, 12                                 Page 7 of 23


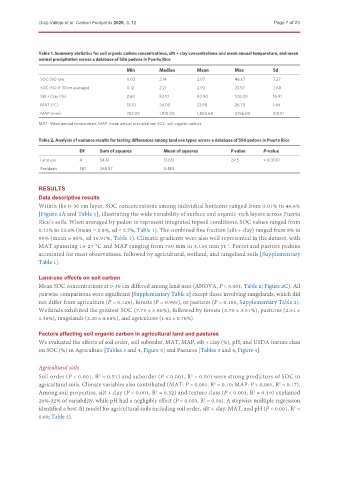
               Table 1. Summary statistics for soil organic carbon concentrations, silt + clay concentrations and mean annual temperature, and mean
               annual precipitation across a database of 586 pedons in Puerto Rico

                                              Min        Median       Mean         Max           Sd
               SOC (%) raw                    0.02       2.14         3.07         46.67         3.27
               SOC (%) 0-30cm averaged        0.12       2.21         2.92         23.57         2.68
               Silt + Clay (%)                2.60       83.10        80.90        100.00        16.91
               MAT (°C)                       18.10      24.00        23.98        26.70         1.64
               MAP (mm)                       752.00     1,810.00     1,804.68     3,156.00      513.51
               MAT: Mean annual temperature; MAP: mean annual precipitation; SOC: soil organic carbon.


               Table 2. Analysis of variance results for testing differences among land use types across a database of 586 pedons in Puerto Rico
                             Df     Sum of squares         Mean of squares        F value     P-value
               Land use      4      54.61                  13.651                 29.5        < 0.0001
               Residuals     581    268.87                 0.463


               RESULTS

               Data descriptive results
               Within the 0-30 cm layer, SOC concentrations among individual horizons ranged from 0.01% to 46.6%
               [Figure 2A and Table 1], illustrating the wide variability of surface and organic-rich layers across Puerto
               Rico’s soils. When averaged by pedon to represent integrated topsoil conditions, SOC values ranged from
               0.12% to 23.6% (mean = 2.9%, sd = 2.7%, Table 1). The combined fine fraction (silt + clay) ranged from 8% to
               99% (mean = 80%, sd 16.91%, Table 1). Climatic gradients were also well represented in the dataset, with
               MAT spanning 18-27 °C and MAP ranging from 750 mm to 3,150 mm yr . Forest and pasture pedons
                                                                                -1
               accounted for most observations, followed by agricultural, wetland, and rangeland soils [Supplementary
               Table 1].


               Land-use effects on soil carbon
               Mean SOC concentrations at 0-30 cm differed among land uses (ANOVA, P < 0.001; Table 2; Figure 2C). All
               pairwise comparisons were significant [Supplementary Table 2] except those involving rangelands, which did
               not differ from agriculture (P = 0.126), forests (P = 0.995), or pastures (P = 0.165, Supplementary Table 2).
               Wetlands exhibited the greatest SOC (7.75 ± 5.80%), followed by forests (3.70 ± 3.51%), pastures (2.51 ±
               1.36%), rangelands (2.20 ± 0.68%), and agriculture (1.62 ± 0.70%).

               Factors affecting soil organic carbon in agricultural land and pastures
               We evaluated the effects of soil order, soil suborder, MAT, MAP, silt + clay (%), pH, and USDA texture class
               on SOC (%) in Agriculture [Tables 3 and 4, Figure 3] and Pastures [Tables 3 and 4, Figure 4].


               Agricultural soils
               Soil order (P < 0.001, R  = 0.51) and suborder (P < 0.001, R  = 0.50) were strong predictors of SOC in
                                    2
                                                                    2
               agricultural soils. Climate variables also contributed (MAT: P = 0.001, R  = 0.10; MAP: P < 0.001, R  = 0.17).
                                                                                                   2
                                                                            2
               Among soil properties, silt + clay (P < 0.001, R  = 0.32) and texture class (P < 0.001, R  = 0.19) explained
                                                                                          2
                                                        2
               20%-32% of variability, while pH had a negligible effect (P = 0.003, R  = 0.08). A stepwise multiple regression
                                                                         2
               identified a best-fit model for agricultural soils including soil order, silt + clay, MAT, and pH (P < 0.001, R  =
                                                                                                        2
               0.60; Table 5).

