


Page 49 - Read online
P. 49
Diaz-Vallejo et al. Carbon Footprints 2026, 5, 12                                 Page 5 of 23


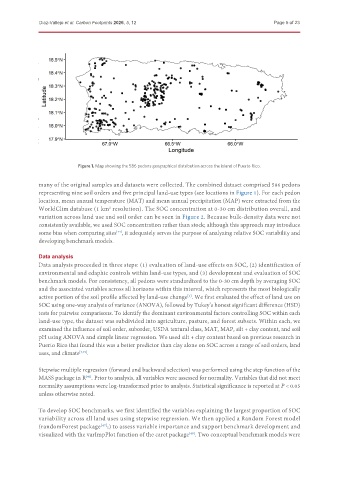
                            Figure 1. Map showing the 586 pedons geographical distribution across the island of Puerto Rico.

               many of the original samples and datasets were collected. The combined dataset comprised 586 pedons
               representing nine soil orders and five principal land-use types (see locations in Figure 1). For each pedon
               location, mean annual temperature (MAT) and mean annual precipitation (MAP) were extracted from the
               WorldClim database (1 km  resolution). The SOC concentration at 0-30 cm distribution overall, and
                                       2
               variation across land use and soil order can be seen in Figure 2. Because bulk-density data were not
               consistently available, we used SOC concentration rather than stock; although this approach may introduce
               some bias when comparing sites , it adequately serves the purpose of analyzing relative SOC variability and
                                          [44]
               developing benchmark models.


               Data analysis
               Data analysis proceeded in three steps: (1) evaluation of land-use effects on SOC, (2) identification of
               environmental and edaphic controls within land-use types, and (3) development and evaluation of SOC
               benchmark models. For consistency, all pedons were standardized to the 0-30 cm depth by averaging SOC
               and the associated variables across all horizons within this interval, which represents the most biologically
               active portion of the soil profile affected by land-use change . We first evaluated the effect of land use on
                                                                   [3]
               SOC using one-way analysis of variance (ANOVA), followed by Tukey’s honest significant difference (HSD)
               tests for pairwise comparisons. To identify the dominant environmental factors controlling SOC within each
               land-use type, the dataset was subdivided into agriculture, pasture, and forest subsets. Within each, we
               examined the influence of soil order, suborder, USDA textural class, MAT, MAP, silt + clay content, and soil
               pH using ANOVA and simple linear regression. We used silt + clay content based on previous research in
               Puerto Rico that found this was a better predictor than clay alone on SOC across a range of soil orders, land
               uses, and climate [7,45] .


               Stepwise multiple regression (forward and backward selection) was performed using the step function of the
               MASS package in R . Prior to analysis, all variables were assessed for normality. Variables that did not meet
                               [46]
               normality assumptions were log-transformed prior to analysis. Statistical significance is reported at P < 0.05
               unless otherwise noted.


               To develop SOC benchmarks, we first identified the variables explaining the largest proportion of SOC
               variability across all land uses using stepwise regression. We then applied a Random Forest model
               (randomForest package ;) to assess variable importance and support benchmark development and
                                    [47]
               visualized with the varImpPlot function of the caret package . Two conceptual benchmark models were
                                                                   [48]

